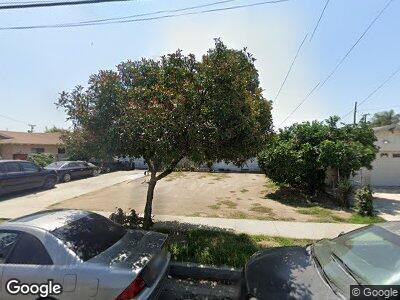
3272 Vineland Ave Baldwin Park, CA 91706
Estimated Value: $649,000 - $720,447
4
Beds
2
Baths
1,279
Sq Ft
$543/Sq Ft
Est. Value
About This Home
This home is located at 3272 Vineland Ave, Baldwin Park, CA 91706 and is currently estimated at $694,112, approximately $542 per square foot. 3272 Vineland Ave is a home located in Los Angeles County with nearby schools including Foster Elementary, Charles D. Jones Junior High School, and Baldwin Park High School.
Ownership History
Date
Name
Owned For
Owner Type
Purchase Details
Closed on
Dec 22, 2022
Sold by
Gonzalez Reynaldo G
Bought by
Gonzalez Yolanda R
Current Estimated Value
Home Financials for this Owner
Home Financials are based on the most recent Mortgage that was taken out on this home.
Original Mortgage
$982,500
Outstanding Balance
$982,044
Interest Rate
7.16%
Mortgage Type
Credit Line Revolving
Estimated Equity
-$267,159
Purchase Details
Closed on
Jun 26, 2021
Sold by
Gonzalez Reynaldo
Bought by
Gonzalez Reynaldo and Gonzalez Yolanda R
Purchase Details
Closed on
Sep 9, 2008
Sold by
Gonzalez Yolanda R
Bought by
Gonzalez Reynaldo
Home Financials for this Owner
Home Financials are based on the most recent Mortgage that was taken out on this home.
Original Mortgage
$532,500
Interest Rate
3.58%
Mortgage Type
Reverse Mortgage Home Equity Conversion Mortgage
Create a Home Valuation Report for This Property
The Home Valuation Report is an in-depth analysis detailing your home's value as well as a comparison with similar homes in the area
Home Values in the Area
Average Home Value in this Area
Purchase History
| Date | Buyer | Sale Price | Title Company |
|---|---|---|---|
| Gonzalez Reynaldo | -- | Accommodation | |
| Gonzalez Reynaldo | -- | Placer Title Company |
Source: Public Records
Mortgage History
| Date | Status | Borrower | Loan Amount |
|---|---|---|---|
| Open | Gonzalez Yolanda R | $982,500 | |
| Closed | Gonzalez Yolanda R | $982,500 | |
| Previous Owner | Gonzalez Reynaldo | $532,500 |
Source: Public Records
Tax History Compared to Growth
Tax History
| Year | Tax Paid | Tax Assessment Tax Assessment Total Assessment is a certain percentage of the fair market value that is determined by local assessors to be the total taxable value of land and additions on the property. | Land | Improvement |
|---|---|---|---|---|
| 2024 | $1,250 | $59,768 | $17,294 | $42,474 |
| 2023 | $1,232 | $58,597 | $16,955 | $41,642 |
| 2022 | $1,235 | $57,449 | $16,623 | $40,826 |
| 2021 | $1,207 | $56,324 | $16,298 | $40,026 |
| 2020 | $1,202 | $55,747 | $16,131 | $39,616 |
| 2019 | $1,155 | $54,655 | $15,815 | $38,840 |
| 2018 | $1,065 | $53,584 | $15,505 | $38,079 |
| 2016 | $989 | $51,504 | $14,903 | $36,601 |
| 2015 | $999 | $50,732 | $14,680 | $36,052 |
| 2014 | $995 | $49,739 | $14,393 | $35,346 |
Source: Public Records
Map
Nearby Homes
- 3149 Stichman Ave
- 14311 Idaho Ave
- 14027 Rockway Dr
- 3000 Vineland Ave Unit 27
- 3000 Vineland Ave Unit 10
- 3537 Maine Ave
- 14460 Bresee Ave
- 14120 Havenbrook St
- 13905 Corak St
- 13655 Foster Ave Unit 10
- 1326 S Halinor Ave
- 3636 Elias Ln
- 3517 Big Dalton Ave
- 13637 Foster Ave Unit 5
- 3541 Big Dalton Ave
- 1244 S Leland Ave
- 2223 W Mossberg Ave
- 3927 Paddy Ln
- 3637 Puente Ave
- 3860 Athol St