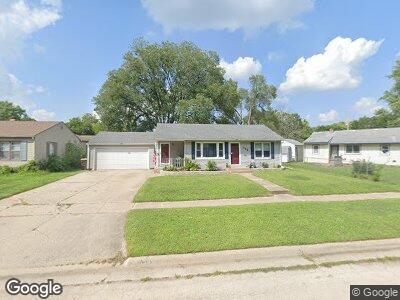
328 Renrose Ave Loves Park, IL 61111
Estimated Value: $113,000 - $160,000
2
Beds
1
Bath
1,140
Sq Ft
$126/Sq Ft
Est. Value
About This Home
This home is located at 328 Renrose Ave, Loves Park, IL 61111 and is currently estimated at $143,194, approximately $125 per square foot. 328 Renrose Ave is a home located in Winnebago County with nearby schools including Windsor Elementary School, Harlem Middle School, and Harlem High School.
Ownership History
Date
Name
Owned For
Owner Type
Purchase Details
Closed on
Feb 9, 2024
Sold by
Daugherty Lisa
Bought by
Adube Insurance Services 40Ik
Current Estimated Value
Purchase Details
Closed on
Sep 4, 2019
Sold by
Bengtson Properties Llc 328 Renrose Aven
Bought by
Daugherty Lisa
Home Financials for this Owner
Home Financials are based on the most recent Mortgage that was taken out on this home.
Original Mortgage
$82,163
Interest Rate
3.75%
Mortgage Type
FHA
Purchase Details
Closed on
Oct 30, 2017
Sold by
Bengtson Joshua M and Bengtson Stephanie
Bought by
Bengtson Properties Llc
Purchase Details
Closed on
Oct 24, 2017
Sold by
Bengtson Joshua M and Bengtson Stephanie
Bought by
Bengtson Properties Llc
Purchase Details
Closed on
Sep 27, 2013
Bought by
Bengtson Michael P and Bengtson Dawn
Create a Home Valuation Report for This Property
The Home Valuation Report is an in-depth analysis detailing your home's value as well as a comparison with similar homes in the area
Home Values in the Area
Average Home Value in this Area
Purchase History
| Date | Buyer | Sale Price | Title Company |
|---|---|---|---|
| Adube Insurance Services 40Ik | $142,000 | None Listed On Document | |
| Daugherty Lisa | $85,000 | Howard Hardyman & Diverde Llp | |
| Bengtson Properties Llc | -- | Title Underwriters Agency | |
| Bengtson Properties Llc | -- | Title Underwriters Agency | |
| Bengtson Michael P | $68,500 | -- |
Source: Public Records
Mortgage History
| Date | Status | Borrower | Loan Amount |
|---|---|---|---|
| Previous Owner | Daugherty Lisa A | $80,000 | |
| Previous Owner | Daugherty Lisa | $82,163 |
Source: Public Records
Tax History Compared to Growth
Tax History
| Year | Tax Paid | Tax Assessment Tax Assessment Total Assessment is a certain percentage of the fair market value that is determined by local assessors to be the total taxable value of land and additions on the property. | Land | Improvement |
|---|---|---|---|---|
| 2023 | $2,312 | $31,606 | $4,134 | $27,472 |
| 2022 | $2,187 | $28,250 | $3,695 | $24,555 |
| 2021 | $2,007 | $25,903 | $3,388 | $22,515 |
| 2020 | $1,814 | $24,488 | $3,203 | $21,285 |
| 2019 | $2,466 | $23,340 | $3,053 | $20,287 |
| 2018 | $2,349 | $23,452 | $2,878 | $20,574 |
| 2017 | $1,961 | $22,444 | $2,754 | $19,690 |
| 2016 | $1,927 | $22,023 | $2,702 | $19,321 |
| 2015 | $1,950 | $22,023 | $2,702 | $19,321 |
| 2014 | $1,634 | $24,015 | $3,370 | $20,645 |
Source: Public Records
Map
Nearby Homes
- 353 Pennsylvania Ave
- 327 Belteberg Rd
- 205 Hosmer St
- 6319 Park Ridge Rd
- 6422 Park Ridge Rd
- 210 Grand Blvd
- 234 E Riverside Blvd
- 6200 Park Ridge Rd
- 124 Sheridan Dr
- 5745 Park Ridge Rd
- 601 River Park Dr
- 709 Marie Ave
- 416 Merrill Ave
- 404 River Ln
- 713 Grand Ave
- 635 Merrill Ave
- 5439 Dale Ave
- 5424 Dale Ave
- 805 Drexel Blvd