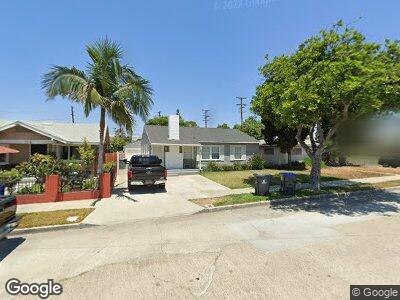
329 E Stanford St Santa Ana, CA 92707
Madison Park NeighborhoodEstimated Value: $824,000 - $876,000
3
Beds
2
Baths
1,540
Sq Ft
$552/Sq Ft
Est. Value
About This Home
This home is located at 329 E Stanford St, Santa Ana, CA 92707 and is currently estimated at $850,189, approximately $552 per square foot. 329 E Stanford St is a home located in Orange County with nearby schools including Manuel Esqueda Elementary School, Julia C. Lathrop Intermediate School, and Century High School.
Ownership History
Date
Name
Owned For
Owner Type
Purchase Details
Closed on
Nov 27, 2013
Sold by
Nieblas Ofelia L
Bought by
Nieblas Ofelia Lucy and The Ofelia Lucy Nieblas Revocable Trust
Current Estimated Value
Purchase Details
Closed on
Sep 17, 2007
Sold by
Nieblas Ophelia L
Bought by
Nieblas Ophelia L and Ophelia L Nieblas Living Trust
Purchase Details
Closed on
Jan 22, 2003
Sold by
Nieblas Ofelia L
Bought by
Nieblas Ofelia L
Home Financials for this Owner
Home Financials are based on the most recent Mortgage that was taken out on this home.
Original Mortgage
$160,000
Outstanding Balance
$73,970
Interest Rate
5.96%
Estimated Equity
$737,263
Purchase Details
Closed on
Sep 21, 1993
Sold by
Nieblas Ofelia L
Bought by
Nieblas Ofelia L
Home Financials for this Owner
Home Financials are based on the most recent Mortgage that was taken out on this home.
Original Mortgage
$33,000
Interest Rate
7.13%
Create a Home Valuation Report for This Property
The Home Valuation Report is an in-depth analysis detailing your home's value as well as a comparison with similar homes in the area
Home Values in the Area
Average Home Value in this Area
Purchase History
| Date | Buyer | Sale Price | Title Company |
|---|---|---|---|
| Nieblas Ofelia Lucy | -- | None Available | |
| Nieblas Ophelia L | -- | None Available | |
| Nieblas Ofelia L | -- | Old Republic Title Company | |
| Nieblas Ofelia L | -- | Gateway Title Company |
Source: Public Records
Mortgage History
| Date | Status | Borrower | Loan Amount |
|---|---|---|---|
| Open | Nieblas Ofelia L | $160,000 | |
| Closed | Nieblas Ofelia L | $85,000 | |
| Closed | Nieblas Ofelia L | $33,000 |
Source: Public Records
Tax History Compared to Growth
Tax History
| Year | Tax Paid | Tax Assessment Tax Assessment Total Assessment is a certain percentage of the fair market value that is determined by local assessors to be the total taxable value of land and additions on the property. | Land | Improvement |
|---|---|---|---|---|
| 2024 | $937 | $56,185 | $23,085 | $33,100 |
| 2023 | $909 | $55,084 | $22,633 | $32,451 |
| 2022 | $892 | $54,004 | $22,189 | $31,815 |
| 2021 | $873 | $52,946 | $21,754 | $31,192 |
| 2020 | $870 | $52,404 | $21,531 | $30,873 |
| 2019 | $857 | $51,377 | $21,109 | $30,268 |
| 2018 | $831 | $50,370 | $20,695 | $29,675 |
| 2017 | $821 | $49,383 | $20,289 | $29,094 |
| 2016 | $806 | $48,415 | $19,891 | $28,524 |
| 2015 | $793 | $47,688 | $19,592 | $28,096 |
| 2014 | $777 | $46,754 | $19,208 | $27,546 |
Source: Public Records
Map
Nearby Homes
- 1435 Orange Ave
- 225 E Occidental St
- 822 E Borchard Ave
- 1331 Cypress Ave
- 1918 S Halladay St
- 2018 Kilson Dr
- 1279 S Hickory St
- 1709 Evergreen St
- 2040 Kilson Dr
- 508 W Edinger Ave
- 2064 S Main St
- 1426 Minnie St
- 711 E Mcfadden Ave
- 2078 Evergreen St
- 1103 Hickory St
- 1303 S Standard Ave Unit A
- 841 E Mcfadden Ave
- 2220 Halladay St
- 829 Normandy Place
- 1268 E Mcfadden Ave Unit C