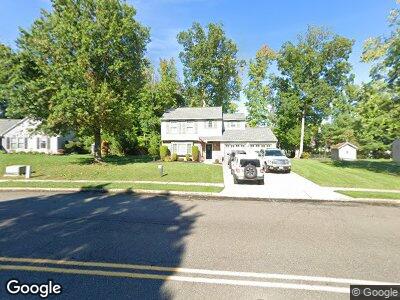
33 Amherst Dr Burlington, NJ 08016
Sunset Ridge NeighborhoodEstimated Value: $442,675 - $514,000
3
Beds
3
Baths
1,736
Sq Ft
$277/Sq Ft
Est. Value
About This Home
This home is located at 33 Amherst Dr, Burlington, NJ 08016 and is currently estimated at $480,919, approximately $277 per square foot. 33 Amherst Dr is a home located in Burlington County with nearby schools including B Bernice Young Elementary School, Fountain Woods Elementary School, and Burlington Township Middle School at Springside.
Ownership History
Date
Name
Owned For
Owner Type
Purchase Details
Closed on
Dec 23, 1992
Bought by
Nixon Howard A and Nixon Joanne E
Current Estimated Value
Create a Home Valuation Report for This Property
The Home Valuation Report is an in-depth analysis detailing your home's value as well as a comparison with similar homes in the area
Home Values in the Area
Average Home Value in this Area
Purchase History
| Date | Buyer | Sale Price | Title Company |
|---|---|---|---|
| Nixon Howard A | $110,000 | -- |
Source: Public Records
Mortgage History
| Date | Status | Borrower | Loan Amount |
|---|---|---|---|
| Open | Nixon Howard A | $87,000 | |
| Closed | Nixon Joanne E | $30,000 | |
| Closed | Nixon Howard A | $20,000 | |
| Closed | Nixon Howard A | $20,000 | |
| Closed | Nixon Howard A | $12,000 | |
| Closed | Nixon Howard A | $24,000 |
Source: Public Records
Tax History Compared to Growth
Tax History
| Year | Tax Paid | Tax Assessment Tax Assessment Total Assessment is a certain percentage of the fair market value that is determined by local assessors to be the total taxable value of land and additions on the property. | Land | Improvement |
|---|---|---|---|---|
| 2024 | $7,094 | $237,500 | $79,600 | $157,900 |
| 2023 | $7,094 | $237,500 | $79,600 | $157,900 |
| 2022 | $7,063 | $237,500 | $79,600 | $157,900 |
| 2021 | $6,372 | $237,500 | $79,600 | $157,900 |
| 2020 | $7,118 | $237,500 | $79,600 | $157,900 |
| 2019 | $7,135 | $237,500 | $79,600 | $157,900 |
| 2018 | $7,028 | $237,500 | $79,600 | $157,900 |
| 2017 | $6,985 | $237,500 | $79,600 | $157,900 |
| 2016 | $5,760 | $192,000 | $75,000 | $117,000 |
| 2015 | $5,660 | $192,000 | $75,000 | $117,000 |
| 2014 | $5,453 | $192,000 | $75,000 | $117,000 |
Source: Public Records
Map
Nearby Homes
- 7 Quincy Manor Ln
- 0 Sunset Rd
- 0 Sunset Rd Unit NJBL2009242
- 708 Sunset Rd
- 0 Salem Rd
- 57 Henderson Ln
- 27 Evergreen Ln
- 42 Taisley Ln
- 15 Evergreen Ln
- 15 Hillcrest Ln
- 1176 Kaye Ct Unit 1176
- 21 Haskell Ln
- 1015 Jardin Ct
- 9 Haskell Ln
- 37 Neptune Ln
- 19 Hargrove Ln
- 78 Barrington Ln
- 45 Hadley Ln
- 26 Bancroft Ln
- 823 Henri Ct