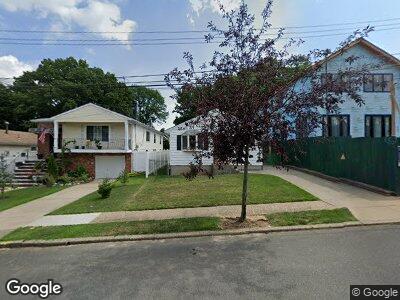
33 Suffolk Ave Staten Island, NY 10314
Manor Heights NeighborhoodEstimated Value: $632,487 - $674,000
--
Bed
4
Baths
864
Sq Ft
$757/Sq Ft
Est. Value
About This Home
This home is located at 33 Suffolk Ave, Staten Island, NY 10314 and is currently estimated at $654,122, approximately $757 per square foot. 33 Suffolk Ave is a home located in Richmond County with nearby schools including P.S. 29 Bardwell, Intermediate School 27, and Susan E Wagner High School.
Ownership History
Date
Name
Owned For
Owner Type
Purchase Details
Closed on
Aug 24, 2021
Sold by
Iken Elizabeth M
Bought by
Iken Mark and Walsh Jennifer
Current Estimated Value
Purchase Details
Closed on
Jul 21, 2021
Sold by
Iken Bernhard F and Iken Elizabeth M
Bought by
Iken Elizabeth M
Create a Home Valuation Report for This Property
The Home Valuation Report is an in-depth analysis detailing your home's value as well as a comparison with similar homes in the area
Home Values in the Area
Average Home Value in this Area
Purchase History
| Date | Buyer | Sale Price | Title Company |
|---|---|---|---|
| Iken Mark | -- | None Available | |
| Iken Elizabeth M | -- | None Available |
Source: Public Records
Tax History Compared to Growth
Tax History
| Year | Tax Paid | Tax Assessment Tax Assessment Total Assessment is a certain percentage of the fair market value that is determined by local assessors to be the total taxable value of land and additions on the property. | Land | Improvement |
|---|---|---|---|---|
| 2024 | $5,724 | $42,900 | $10,809 | $32,091 |
| 2023 | $5,433 | $28,151 | $10,431 | $17,720 |
| 2022 | $5,015 | $38,640 | $15,540 | $23,100 |
| 2021 | $4,970 | $33,420 | $15,540 | $17,880 |
| 2020 | $5,008 | $33,000 | $15,540 | $17,460 |
| 2019 | $4,909 | $34,260 | $15,540 | $18,720 |
| 2018 | $4,484 | $23,459 | $11,844 | $11,615 |
| 2017 | $4,212 | $22,132 | $13,583 | $8,549 |
| 2016 | $3,864 | $20,880 | $15,540 | $5,340 |
| 2015 | $4,356 | $24,420 | $15,180 | $9,240 |
| 2014 | $4,356 | $24,288 | $15,098 | $9,190 |
Source: Public Records
Map
Nearby Homes
- 244 Gansevoort Blvd
- 273 Gansevoort Blvd
- 226 Perry Ave
- 35 Duke Place
- 192 Gansevoort Blvd
- 164 Queen St
- 331 Mountainview Ave
- 147 Roosevelt Ave
- 365 Buchanan Ave
- 173 Roosevelt Ave
- 372 Gower St
- 127 Bradley Ave
- 109 Quinlan Ave
- 184 Livingston Ave
- 241 Fanning St
- 97 Quinlan Ave
- 407 Mountainview Ave
- 334 Kell Ave
- 387 Fanning St
- 144 Purdy Ave