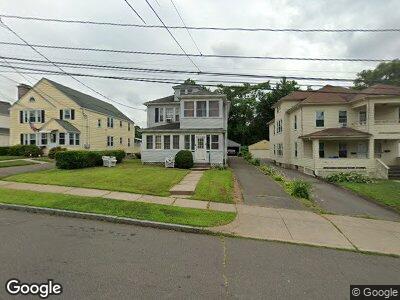
33 Woodmere Rd Unit 2nd fl West Hartford, CT 06119
Estimated Value: $426,197 - $516,000
2
Beds
1
Bath
1,360
Sq Ft
$356/Sq Ft
Est. Value
About This Home
This home is located at 33 Woodmere Rd Unit 2nd fl, West Hartford, CT 06119 and is currently estimated at $484,049, approximately $355 per square foot. 33 Woodmere Rd Unit 2nd fl is a home located in Hartford County with nearby schools including Smith School, King Philip Middle School, and Hall High School.
Ownership History
Date
Name
Owned For
Owner Type
Purchase Details
Closed on
Sep 5, 2006
Sold by
Mary Ruth Schramke T and Schramke Mary Ruth
Bought by
Doyle Andrea M
Current Estimated Value
Home Financials for this Owner
Home Financials are based on the most recent Mortgage that was taken out on this home.
Original Mortgage
$31,750
Outstanding Balance
$13,586
Interest Rate
6.79%
Estimated Equity
$470,463
Create a Home Valuation Report for This Property
The Home Valuation Report is an in-depth analysis detailing your home's value as well as a comparison with similar homes in the area
Home Values in the Area
Average Home Value in this Area
Purchase History
| Date | Buyer | Sale Price | Title Company |
|---|---|---|---|
| Doyle Andrea M | $327,500 | -- |
Source: Public Records
Mortgage History
| Date | Status | Borrower | Loan Amount |
|---|---|---|---|
| Open | Schramke Mary | $31,750 | |
| Open | Schramke Mary | $327,000 | |
| Previous Owner | Schramke Mary | $50,000 | |
| Previous Owner | Schramke Mary | $112,500 |
Source: Public Records
Tax History Compared to Growth
Tax History
| Year | Tax Paid | Tax Assessment Tax Assessment Total Assessment is a certain percentage of the fair market value that is determined by local assessors to be the total taxable value of land and additions on the property. | Land | Improvement |
|---|---|---|---|---|
| 2024 | $8,318 | $196,420 | $70,910 | $125,510 |
| 2023 | $7,740 | $189,140 | $70,910 | $118,230 |
| 2022 | $7,694 | $189,140 | $70,910 | $118,230 |
| 2021 | $8,050 | $189,770 | $57,500 | $132,270 |
| 2020 | $7,932 | $189,770 | $49,300 | $140,470 |
| 2019 | $7,932 | $189,770 | $49,280 | $140,490 |
| 2018 | $7,781 | $189,770 | $49,280 | $140,490 |
| 2017 | $7,788 | $189,770 | $49,280 | $140,490 |
| 2016 | $7,525 | $190,470 | $52,640 | $137,830 |
| 2015 | $7,297 | $190,470 | $52,640 | $137,830 |
| 2014 | $7,118 | $190,470 | $52,640 | $137,830 |
Source: Public Records
Map
Nearby Homes