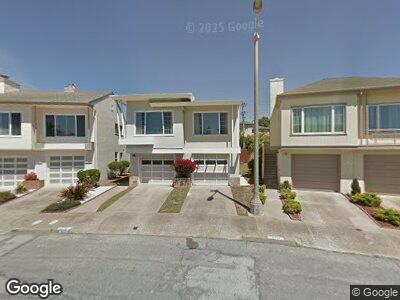
330 Country Club Dr San Francisco, CA 94132
Southshore NeighborhoodEstimated Value: $1,611,000 - $2,020,000
4
Beds
2
Baths
1,431
Sq Ft
$1,251/Sq Ft
Est. Value
About This Home
This home is located at 330 Country Club Dr, San Francisco, CA 94132 and is currently estimated at $1,789,484, approximately $1,250 per square foot. 330 Country Club Dr is a home located in San Francisco County with nearby schools including Ulloa Elementary School, Hoover (Herbert) Middle School, and St. Gabriel School.
Ownership History
Date
Name
Owned For
Owner Type
Purchase Details
Closed on
Dec 17, 2020
Sold by
Cheuk Joanna
Bought by
Cheuk Christopher
Current Estimated Value
Home Financials for this Owner
Home Financials are based on the most recent Mortgage that was taken out on this home.
Original Mortgage
$510,000
Outstanding Balance
$424,121
Interest Rate
2.8%
Mortgage Type
New Conventional
Estimated Equity
$1,365,363
Purchase Details
Closed on
Oct 16, 2009
Sold by
Zaarour Esaam
Bought by
Cheuk Eugene Yui Chung and Cheuk Jennifer
Home Financials for this Owner
Home Financials are based on the most recent Mortgage that was taken out on this home.
Original Mortgage
$729,750
Interest Rate
5.05%
Mortgage Type
New Conventional
Purchase Details
Closed on
Mar 19, 2004
Sold by
Zaarour Joseph B and Zaarour Alice
Bought by
Zaarour Joseph
Purchase Details
Closed on
Oct 24, 1994
Sold by
Azadkhanian Azad and Azadkhanian Helen
Bought by
Zaarour Joseph B and Zaarour Alice
Create a Home Valuation Report for This Property
The Home Valuation Report is an in-depth analysis detailing your home's value as well as a comparison with similar homes in the area
Home Values in the Area
Average Home Value in this Area
Purchase History
| Date | Buyer | Sale Price | Title Company |
|---|---|---|---|
| Cheuk Christopher | -- | Chicago Title Company | |
| Cheuk Eugene Yui Chung | -- | Chicago Title Company | |
| Cheuk Eugene Yui Chung | $955,000 | Fidelity National Title Co | |
| Zaarour Joseph | -- | -- | |
| Zaarour Joseph B | -- | Old Republic Title Company |
Source: Public Records
Mortgage History
| Date | Status | Borrower | Loan Amount |
|---|---|---|---|
| Open | Cheuk Christopher | $510,000 | |
| Closed | Cheuk Eugene Yui Chung | $712,000 | |
| Closed | Cheuk Eugene Yui Chung | $729,750 |
Source: Public Records
Tax History Compared to Growth
Tax History
| Year | Tax Paid | Tax Assessment Tax Assessment Total Assessment is a certain percentage of the fair market value that is determined by local assessors to be the total taxable value of land and additions on the property. | Land | Improvement |
|---|---|---|---|---|
| 2024 | $16,250 | $1,319,789 | $845,970 | $473,819 |
| 2023 | $16,004 | $1,293,917 | $829,383 | $464,534 |
| 2022 | $15,698 | $1,268,552 | $813,123 | $455,429 |
| 2021 | $15,420 | $1,243,688 | $797,181 | $446,507 |
| 2020 | $15,543 | $1,230,947 | $789,009 | $441,938 |
| 2019 | $14,962 | $1,206,819 | $773,541 | $433,278 |
| 2018 | $14,457 | $1,183,050 | $758,301 | $424,749 |
| 2017 | $13,364 | $1,106,514 | $743,433 | $363,081 |
| 2016 | $13,144 | $1,084,821 | $728,856 | $355,965 |
| 2015 | $12,899 | $1,068,531 | $717,909 | $350,622 |
| 2014 | $12,558 | $1,047,606 | $703,848 | $343,758 |
Source: Public Records
Map
Nearby Homes