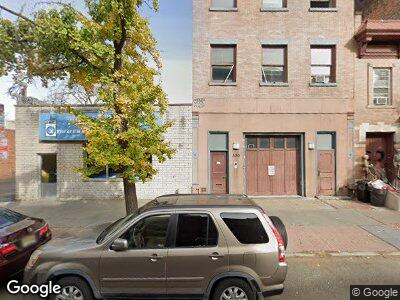
330 Montgomery St Unit 3 Jersey City, NJ 07302
Downtown Jersey City NeighborhoodEstimated Value: $1,524,000 - $2,122,000
3
Beds
2
Baths
2,200
Sq Ft
$787/Sq Ft
Est. Value
About This Home
This home is located at 330 Montgomery St Unit 3, Jersey City, NJ 07302 and is currently estimated at $1,732,333, approximately $787 per square foot. 330 Montgomery St Unit 3 is a home located in Hudson County with nearby schools including Frank R. Conwell Middle School - M.S. 4, James J. Ferris High School, and Dr Ronald McNair High School.
Ownership History
Date
Name
Owned For
Owner Type
Purchase Details
Closed on
Oct 14, 2024
Sold by
Mulrenan Corinne
Bought by
330 Montgomery Llc
Current Estimated Value
Home Financials for this Owner
Home Financials are based on the most recent Mortgage that was taken out on this home.
Original Mortgage
$1,100,000
Outstanding Balance
$1,096,748
Interest Rate
6.08%
Mortgage Type
New Conventional
Estimated Equity
$635,585
Purchase Details
Closed on
Jul 1, 1999
Sold by
Delforno Louis and Delforno Michael
Bought by
Solter Michael and Mulrenan Corinne
Home Financials for this Owner
Home Financials are based on the most recent Mortgage that was taken out on this home.
Original Mortgage
$334,800
Interest Rate
7.19%
Create a Home Valuation Report for This Property
The Home Valuation Report is an in-depth analysis detailing your home's value as well as a comparison with similar homes in the area
Home Values in the Area
Average Home Value in this Area
Purchase History
| Date | Buyer | Sale Price | Title Company |
|---|---|---|---|
| 330 Montgomery Llc | $1,500,000 | Westcor Land Title | |
| 330 Montgomery Llc | $1,500,000 | Westcor Land Title | |
| Solter Michael | $462,500 | -- |
Source: Public Records
Mortgage History
| Date | Status | Borrower | Loan Amount |
|---|---|---|---|
| Open | 330 Montgomery Llc | $1,100,000 | |
| Closed | 330 Montgomery Llc | $1,100,000 | |
| Previous Owner | Solter Michael | $452,100 | |
| Previous Owner | Solter Michael | $30,000 | |
| Previous Owner | Solter Michael | $75,000 | |
| Previous Owner | Solter Michael | $334,800 |
Source: Public Records
Tax History Compared to Growth
Tax History
| Year | Tax Paid | Tax Assessment Tax Assessment Total Assessment is a certain percentage of the fair market value that is determined by local assessors to be the total taxable value of land and additions on the property. | Land | Improvement |
|---|---|---|---|---|
| 2024 | $47,239 | $2,102,300 | $720,000 | $1,382,300 |
| 2023 | $47,239 | $2,102,300 | $720,000 | $1,382,300 |
| 2022 | $44,527 | $2,102,300 | $720,000 | $1,382,300 |
| 2021 | $33,721 | $2,102,300 | $720,000 | $1,382,300 |
| 2020 | $33,847 | $2,102,300 | $720,000 | $1,382,300 |
| 2019 | $32,375 | $2,102,300 | $720,000 | $1,382,300 |
| 2018 | $3,571 | $2,387,900 | $720,000 | $1,667,900 |
| 2017 | $18,720 | $240,000 | $39,400 | $200,600 |
| 2016 | $18,482 | $240,000 | $39,400 | $200,600 |
| 2015 | $17,957 | $240,000 | $39,400 | $200,600 |
| 2014 | $17,842 | $240,000 | $39,400 | $200,600 |
Source: Public Records
Map
Nearby Homes
- 309 Varick St
- 295 Varick St
- 292 Varick St
- 167 Wayne St Unit 407
- 124 Mercer St Unit 2
- 343 Varick St Unit 2A
- 347 Varick St Unit 114A
- 347 Varick St Unit 122A
- 284 Monmouth St Unit F
- 158 Wayne St Unit 108
- 158 Wayne St Unit 404a
- 158 Wayne St Unit 327A
- 158 Wayne St Unit 411A
- 187 Wayne St Unit 408C
- 187 Wayne St Unit 117C
- 187 Wayne St Unit 317C
- 187 Wayne St Unit 118C
- 187 Wayne St Unit 207C
- 187 Wayne St Unit 315C
- 187 Wayne St Unit 208C