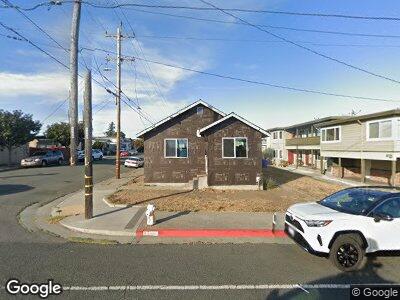
3301 Barrett Ave Richmond, CA 94805
North & East NeighborhoodEstimated Value: $345,000 - $489,581
2
Beds
1
Bath
1,119
Sq Ft
$380/Sq Ft
Est. Value
About This Home
This home is located at 3301 Barrett Ave, Richmond, CA 94805 and is currently estimated at $425,527, approximately $380 per square foot. 3301 Barrett Ave is a home located in Contra Costa County with nearby schools including Michelle Obama School, Lovonya DeJean Middle School, and John F. Kennedy High School.
Ownership History
Date
Name
Owned For
Owner Type
Purchase Details
Closed on
Sep 10, 2020
Sold by
Haynes Elvira Tuck
Bought by
Ochoa Zaragoza Manuel and Santamaria Ana
Current Estimated Value
Home Financials for this Owner
Home Financials are based on the most recent Mortgage that was taken out on this home.
Original Mortgage
$135,000
Outstanding Balance
$121,692
Interest Rate
2.9%
Mortgage Type
Commercial
Estimated Equity
$344,000
Purchase Details
Closed on
Oct 15, 2018
Sold by
Haynes Elvira
Bought by
Haynes Elvira Tuck
Purchase Details
Closed on
Jan 27, 1997
Sold by
Haynes and Elvira
Bought by
Haynes Joseph and Haynes Elvira
Create a Home Valuation Report for This Property
The Home Valuation Report is an in-depth analysis detailing your home's value as well as a comparison with similar homes in the area
Home Values in the Area
Average Home Value in this Area
Purchase History
| Date | Buyer | Sale Price | Title Company |
|---|---|---|---|
| Ochoa Zaragoza Manuel | $235,000 | Old Republic Title Company | |
| Haynes Elvira Tuck | -- | None Available | |
| Haynes Joseph | -- | -- |
Source: Public Records
Mortgage History
| Date | Status | Borrower | Loan Amount |
|---|---|---|---|
| Open | Ochoa Zaragoza Manuel | $135,000 |
Source: Public Records
Tax History Compared to Growth
Tax History
| Year | Tax Paid | Tax Assessment Tax Assessment Total Assessment is a certain percentage of the fair market value that is determined by local assessors to be the total taxable value of land and additions on the property. | Land | Improvement |
|---|---|---|---|---|
| 2024 | $4,968 | $249,383 | $212,241 | $37,142 |
| 2023 | $4,968 | $244,494 | $208,080 | $36,414 |
| 2022 | $4,857 | $239,700 | $204,000 | $35,700 |
| 2021 | $4,784 | $235,000 | $200,000 | $35,000 |
| 2019 | $2,310 | $74,381 | $28,185 | $46,196 |
| 2018 | $2,219 | $72,924 | $27,633 | $45,291 |
| 2017 | $2,148 | $71,495 | $27,092 | $44,403 |
| 2016 | $2,083 | $70,094 | $26,561 | $43,533 |
| 2015 | $2,040 | $69,043 | $26,163 | $42,880 |
| 2014 | $2,030 | $67,692 | $25,651 | $42,041 |
Source: Public Records
Map
Nearby Homes