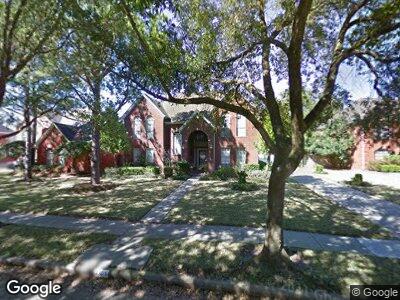
3303 Vista Lake Dr Sugar Land, TX 77478
Riverbend NeighborhoodEstimated Value: $438,453 - $484,000
5
Beds
3
Baths
3,122
Sq Ft
$148/Sq Ft
Est. Value
About This Home
This home is located at 3303 Vista Lake Dr, Sugar Land, TX 77478 and is currently estimated at $462,613, approximately $148 per square foot. 3303 Vista Lake Dr is a home located in Fort Bend County with nearby schools including Highlands Elementary School, Dulles Middle School, and Dulles High School.
Ownership History
Date
Name
Owned For
Owner Type
Purchase Details
Closed on
Aug 23, 2022
Sold by
Pham Nguyen Jackie
Bought by
Harkor Homes Llc
Current Estimated Value
Purchase Details
Closed on
Jul 10, 2019
Sold by
Nguyen Nathan Phuc
Bought by
Pham Nguyen Jackie
Home Financials for this Owner
Home Financials are based on the most recent Mortgage that was taken out on this home.
Original Mortgage
$342,000
Interest Rate
3.82%
Mortgage Type
New Conventional
Purchase Details
Closed on
Feb 16, 2017
Sold by
Yeung Josephine
Bought by
Nguyen Jackie Pham and Nguyen Nathan Phue
Home Financials for this Owner
Home Financials are based on the most recent Mortgage that was taken out on this home.
Original Mortgage
$342,000
Interest Rate
4.2%
Mortgage Type
New Conventional
Purchase Details
Closed on
Mar 13, 1995
Sold by
Louie Betty Li Ping
Bought by
Louie Betty Li Ping and Betty Li Ping Louie Revocable Trust
Create a Home Valuation Report for This Property
The Home Valuation Report is an in-depth analysis detailing your home's value as well as a comparison with similar homes in the area
Home Values in the Area
Average Home Value in this Area
Purchase History
| Date | Buyer | Sale Price | Title Company |
|---|---|---|---|
| Harkor Homes Llc | -- | None Listed On Document | |
| Pham Nguyen Jackie | -- | None Available | |
| Nguyen Jackie Pham | -- | None Available | |
| Louie Betty Li Ping | -- | -- | |
| Yeung Josephine | -- | -- |
Source: Public Records
Mortgage History
| Date | Status | Borrower | Loan Amount |
|---|---|---|---|
| Previous Owner | Nguyen Jackie | $342,000 | |
| Previous Owner | Pham Nguyen Jackie | $342,000 | |
| Previous Owner | Nguyen Jackie Pham | $342,000 |
Source: Public Records
Tax History Compared to Growth
Tax History
| Year | Tax Paid | Tax Assessment Tax Assessment Total Assessment is a certain percentage of the fair market value that is determined by local assessors to be the total taxable value of land and additions on the property. | Land | Improvement |
|---|---|---|---|---|
| 2023 | $2,177 | $114,371 | $75,075 | $39,296 |
| 2022 | $8,910 | $429,950 | $75,080 | $354,870 |
| 2021 | $7,953 | $368,470 | $75,080 | $293,390 |
| 2020 | $8,059 | $369,850 | $75,080 | $294,770 |
| 2019 | $8,072 | $359,290 | $65,000 | $294,290 |
| 2018 | $8,316 | $374,980 | $65,000 | $309,980 |
| 2017 | $3,884 | $173,670 | $32,500 | $141,170 |
| 2016 | $3,645 | $162,980 | $32,500 | $130,480 |
| 2015 | $2,226 | $148,160 | $32,500 | $115,660 |
| 2014 | $2,187 | $134,690 | $32,500 | $102,190 |
Source: Public Records
Map
Nearby Homes
- 3455 Summer Bay Dr
- 2027 Richland Ct
- 3222 Serene Oak Dr
- 2019 Teakwood Place
- 3406 Honey Creek Dr
- 3518 Woodmere Ln
- 3119 Waters Way Dr
- 2011 Creek Valley Ln
- 1935 Creekshire Dr
- 1839 Creekshire Dr
- 1722 Randons Point Dr
- 1811 Sugar Crossing Dr
- 2758 Quarry Hill Rd
- 2410 Lively Ln
- 2202 Windy Meadow Dr
- 4107 Alice Dr
- 2723 Ferry Landing
- 3938 Kitchen Hill Ln
- 2926 Deer Creek Dr
- 3307 Meadowside Dr