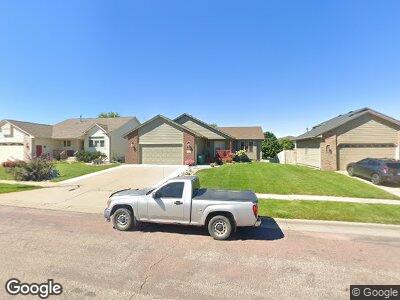
3319 S Alpine Ave Sioux Falls, SD 57110
Estimated Value: $372,000 - $388,000
4
Beds
3
Baths
2,177
Sq Ft
$175/Sq Ft
Est. Value
About This Home
This home is located at 3319 S Alpine Ave, Sioux Falls, SD 57110 and is currently estimated at $381,022, approximately $175 per square foot. 3319 S Alpine Ave is a home located in Minnehaha County with nearby schools including John Harris Elementary School, Washington High School, and Train Up A Child Preschool/Kindergarten.
Ownership History
Date
Name
Owned For
Owner Type
Purchase Details
Closed on
Oct 25, 2023
Sold by
Lloyd Lee Llc
Bought by
Bautista Joaquin Davila and Rodrigues Alba
Current Estimated Value
Home Financials for this Owner
Home Financials are based on the most recent Mortgage that was taken out on this home.
Original Mortgage
$309,400
Outstanding Balance
$305,142
Interest Rate
7.31%
Estimated Equity
$87,059
Purchase Details
Closed on
Aug 24, 2018
Sold by
Li Shenjing and Liang Yun
Bought by
Lloyd Lee Llc
Purchase Details
Closed on
Oct 23, 2014
Sold by
Marjorie J Marjorie J and Peterson Marjorie J
Bought by
Li Shenjing and Liang Yun
Home Financials for this Owner
Home Financials are based on the most recent Mortgage that was taken out on this home.
Original Mortgage
$161,250
Interest Rate
4.19%
Mortgage Type
New Conventional
Create a Home Valuation Report for This Property
The Home Valuation Report is an in-depth analysis detailing your home's value as well as a comparison with similar homes in the area
Home Values in the Area
Average Home Value in this Area
Purchase History
| Date | Buyer | Sale Price | Title Company |
|---|---|---|---|
| Bautista Joaquin Davila | $364,000 | Stewart Title Co | |
| Lloyd Lee Llc | -- | None Available | |
| Li Shenjing | $215,000 | Dataquick Title Llc |
Source: Public Records
Mortgage History
| Date | Status | Borrower | Loan Amount |
|---|---|---|---|
| Open | Bautista Joaquin Davila | $309,400 | |
| Closed | Bautista Joaquin Davila | $309,400 | |
| Closed | Bautista Joaquin Davila | $309,400 | |
| Previous Owner | Li Shenjing | $161,250 |
Source: Public Records
Tax History Compared to Growth
Tax History
| Year | Tax Paid | Tax Assessment Tax Assessment Total Assessment is a certain percentage of the fair market value that is determined by local assessors to be the total taxable value of land and additions on the property. | Land | Improvement |
|---|---|---|---|---|
| 2024 | $4,596 | $340,200 | $31,900 | $308,300 |
| 2023 | $6,114 | $350,400 | $31,900 | $318,500 |
| 2022 | $5,600 | $303,100 | $31,900 | $271,200 |
| 2021 | $4,623 | $261,600 | $0 | $0 |
| 2020 | $4,623 | $240,200 | $0 | $0 |
| 2019 | $4,611 | $234,649 | $0 | $0 |
| 2018 | $3,413 | $229,449 | $0 | $0 |
| 2017 | $3,358 | $216,659 | $30,096 | $186,563 |
| 2016 | $3,358 | $213,357 | $30,096 | $183,261 |
| 2015 | $3,280 | $200,216 | $28,512 | $171,704 |
| 2014 | -- | $185,321 | $28,656 | $156,665 |
Source: Public Records
Map
Nearby Homes
- 3426 S Alpine Ave
- 4612 E Pampas Place
- 3124 S Alpine Ave
- 3141 S Harmony Ct
- 3132 S Newcastle Ct
- 2904 S Alpine Ave
- 3533 S Prairie Gardens Place
- 4435 E 38th St
- 3246 S Serenity Trail
- 4439 E 37th St
- 3709 S Pillsberry Ave
- 6629 E 49th St
- 4405 E 36th St
- 3809 S Florence Ave
- 2508 S Alpine Ave
- 5501 E Morningside Cir
- 4809 E 53rd St
- 5508 E Morningside Cir
- 4312 S Poppies Ave
- 3700 E 42nd St