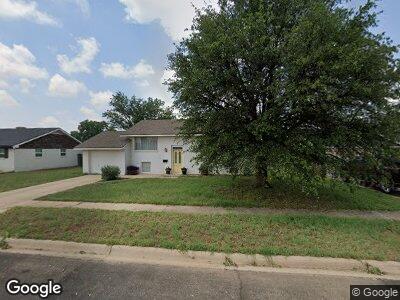
3322 W Shandon Ave Midland, TX 79707
Hyde Park NeighborhoodEstimated Value: $274,000 - $296,246
4
Beds
2
Baths
1,872
Sq Ft
$152/Sq Ft
Est. Value
About This Home
This home is located at 3322 W Shandon Ave, Midland, TX 79707 and is currently estimated at $284,062, approximately $151 per square foot. 3322 W Shandon Ave is a home located in Midland County with nearby schools including Rusk Elementary School, Alamo Junior High School, and Legacy Senior High School.
Ownership History
Date
Name
Owned For
Owner Type
Purchase Details
Closed on
Dec 6, 2024
Sold by
Hiatt Christopher and Hiatt Soledad
Bought by
Cilento Marissa
Current Estimated Value
Home Financials for this Owner
Home Financials are based on the most recent Mortgage that was taken out on this home.
Original Mortgage
$274,928
Outstanding Balance
$274,681
Interest Rate
6.54%
Mortgage Type
FHA
Estimated Equity
-$3,673
Purchase Details
Closed on
Sep 21, 2011
Sold by
Rodden Troy Andra and Adams John Howard
Bought by
Hiatt Christopher
Home Financials for this Owner
Home Financials are based on the most recent Mortgage that was taken out on this home.
Original Mortgage
$107,350
Interest Rate
4.34%
Mortgage Type
New Conventional
Purchase Details
Closed on
Jul 6, 2011
Sold by
Palmer Tamra
Bought by
Adams John Howard
Purchase Details
Closed on
Oct 16, 1978
Bought by
Hiatt Christopher
Create a Home Valuation Report for This Property
The Home Valuation Report is an in-depth analysis detailing your home's value as well as a comparison with similar homes in the area
Home Values in the Area
Average Home Value in this Area
Purchase History
| Date | Buyer | Sale Price | Title Company |
|---|---|---|---|
| Cilento Marissa | -- | West Texas Abstract & Title | |
| Cilento Marissa | -- | West Texas Abstract & Title | |
| Hiatt Christopher | -- | Lone Star Abstract & Titl | |
| Adams John Howard | $85,000 | None Available | |
| Hiatt Christopher | -- | -- |
Source: Public Records
Mortgage History
| Date | Status | Borrower | Loan Amount |
|---|---|---|---|
| Open | Cilento Marissa | $274,928 | |
| Closed | Cilento Marissa | $274,928 | |
| Previous Owner | Hiatt Christopher | $107,350 |
Source: Public Records
Tax History Compared to Growth
Tax History
| Year | Tax Paid | Tax Assessment Tax Assessment Total Assessment is a certain percentage of the fair market value that is determined by local assessors to be the total taxable value of land and additions on the property. | Land | Improvement |
|---|---|---|---|---|
| 2024 | $1,342 | $259,340 | $17,480 | $241,860 |
| 2023 | $1,112 | $253,340 | $17,480 | $235,860 |
| 2022 | $2,009 | $222,080 | $17,480 | $204,600 |
| 2021 | $2,036 | $133,050 | $17,480 | $115,570 |
| 2020 | $1,441 | $131,930 | $17,480 | $114,450 |
| 2019 | $1,829 | $96,590 | $17,480 | $114,450 |
| 2018 | $1,707 | $87,810 | $17,480 | $70,330 |
| 2017 | $2,311 | $118,870 | $17,480 | $101,390 |
| 2016 | $2,344 | $120,330 | $17,480 | $102,850 |
| 2015 | -- | $120,330 | $17,480 | $102,850 |
| 2014 | -- | $120,070 | $0 | $0 |
Source: Public Records
Map
Nearby Homes
- 3319 Camarie Ave
- 3318 W Dengar Ave
- 3314 Cimmaron Ave
- 3517 Imperial Ave
- 3504 Hyde Park Ave
- 3226 W Dengar Ave
- 2611 Boeing Dr
- 3218 Camarie Ave
- 3204 Cimmaron Ave
- 3300 Cord Dr
- 2902 Rebel Dr
- 3307 Stanolind Ct
- 3204 W Wadley Ave
- 3108 Seaboard Ave
- 3511 Stanolind Ave
- 8 Ridgmar Ct
- 3910 Trinity Dr
- 3600 Woodhaven Ct
- 2817 W Shandon Ave
- 3 Marinor Ct