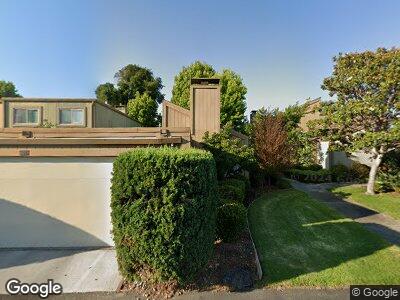
3329 Cook Ln Alameda, CA 94502
Harbor Bay/Bay Farm NeighborhoodEstimated Value: $815,232 - $900,000
2
Beds
2
Baths
1,274
Sq Ft
$687/Sq Ft
Est. Value
About This Home
This home is located at 3329 Cook Ln, Alameda, CA 94502 and is currently estimated at $874,808, approximately $686 per square foot. 3329 Cook Ln is a home located in Alameda County with nearby schools including Amelia Earhart Elementary School, Lincoln Middle School, and Alameda High School.
Ownership History
Date
Name
Owned For
Owner Type
Purchase Details
Closed on
May 10, 2010
Sold by
Aurora Loan Services Llc
Bought by
Yang Chen and Yang Ning
Current Estimated Value
Purchase Details
Closed on
Apr 7, 2010
Sold by
Erwen Lawrence Scott
Bought by
Aurora Loan Services Llc
Purchase Details
Closed on
May 3, 2006
Sold by
Erwen Lawrence Scott
Bought by
Erwen Lawrence S
Home Financials for this Owner
Home Financials are based on the most recent Mortgage that was taken out on this home.
Original Mortgage
$112,000
Interest Rate
6.41%
Mortgage Type
Credit Line Revolving
Purchase Details
Closed on
Mar 7, 2006
Sold by
Lucian Fred H and The Lucian Trust
Bought by
Erwen Lawrence Scott
Home Financials for this Owner
Home Financials are based on the most recent Mortgage that was taken out on this home.
Original Mortgage
$112,000
Interest Rate
6.41%
Mortgage Type
Credit Line Revolving
Purchase Details
Closed on
Oct 14, 2002
Sold by
Lucian Fred H
Bought by
Lucian Fred H and The Lucian Trust
Create a Home Valuation Report for This Property
The Home Valuation Report is an in-depth analysis detailing your home's value as well as a comparison with similar homes in the area
Home Values in the Area
Average Home Value in this Area
Purchase History
| Date | Buyer | Sale Price | Title Company |
|---|---|---|---|
| Yang Chen | $410,000 | North American Title Company | |
| Aurora Loan Services Llc | $493,234 | Accommodation | |
| Erwen Lawrence S | -- | First American Title Co | |
| Erwen Lawrence Scott | $560,000 | Placer Title Company | |
| Lucian Fred H | -- | -- |
Source: Public Records
Mortgage History
| Date | Status | Borrower | Loan Amount |
|---|---|---|---|
| Previous Owner | Erwen Lawrence S | $112,000 | |
| Previous Owner | Erwen Lawrence Scott | $448,000 |
Source: Public Records
Tax History Compared to Growth
Tax History
| Year | Tax Paid | Tax Assessment Tax Assessment Total Assessment is a certain percentage of the fair market value that is determined by local assessors to be the total taxable value of land and additions on the property. | Land | Improvement |
|---|---|---|---|---|
| 2024 | $8,104 | $511,825 | $155,647 | $363,178 |
| 2023 | $7,805 | $508,653 | $152,596 | $356,057 |
| 2022 | $7,634 | $491,682 | $149,604 | $349,078 |
| 2021 | $7,452 | $481,908 | $146,672 | $342,236 |
| 2020 | $7,365 | $483,897 | $145,169 | $338,728 |
| 2019 | $6,949 | $474,410 | $142,323 | $332,087 |
| 2018 | $6,778 | $465,111 | $139,533 | $325,578 |
| 2017 | $6,479 | $455,993 | $136,798 | $319,195 |
| 2016 | $6,478 | $447,055 | $134,116 | $312,939 |
| 2015 | $6,454 | $440,343 | $132,103 | $308,240 |
| 2014 | $6,171 | $431,721 | $129,516 | $302,205 |
Source: Public Records
Map
Nearby Homes
- 1179 Island Dr
- 3409 Catalina Ave
- 1126 Admiralty Ln
- 1044 Verdemar Dr
- 1071 Mangrove Ln
- 48 Garden Rd
- 125 Garden Rd
- 224 Maitland Dr
- 9 Cotella Ct
- 154 Payot Ct
- 818 Ironwood Rd
- 1009 Ironwood Rd
- 1117 Ironwood Rd
- 228 Encounter Bay
- 57 Britt Ct
- 121 Jervis Bay
- 329 Capetown Dr
- 412 Mcdonnel Rd
- 222 Puddingstone Rd
- 167 Purcell Dr