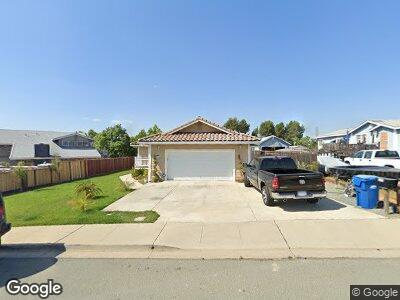
3331 Oakley Rd Antioch, CA 94509
Neroly NeighborhoodEstimated Value: $587,000 - $749,329
4
Beds
3
Baths
2,631
Sq Ft
$260/Sq Ft
Est. Value
About This Home
This home is located at 3331 Oakley Rd, Antioch, CA 94509 and is currently estimated at $684,082, approximately $260 per square foot. 3331 Oakley Rd is a home located in Contra Costa County with nearby schools including Orchard Park School, Dallas Ranch Middle School, and Deer Valley High School.
Ownership History
Date
Name
Owned For
Owner Type
Purchase Details
Closed on
Sep 12, 2018
Sold by
Morgan Andrew and Morgan Andrew S
Bought by
Morgan Andrew
Current Estimated Value
Home Financials for this Owner
Home Financials are based on the most recent Mortgage that was taken out on this home.
Original Mortgage
$440,000
Interest Rate
4.5%
Mortgage Type
New Conventional
Purchase Details
Closed on
Jan 8, 2016
Sold by
Summers Sheila
Bought by
Morgan Andrew S
Home Financials for this Owner
Home Financials are based on the most recent Mortgage that was taken out on this home.
Original Mortgage
$368,207
Interest Rate
3.92%
Mortgage Type
FHA
Purchase Details
Closed on
Mar 15, 2006
Sold by
Naughton Patrick V
Bought by
Naughton Patrick
Create a Home Valuation Report for This Property
The Home Valuation Report is an in-depth analysis detailing your home's value as well as a comparison with similar homes in the area
Home Values in the Area
Average Home Value in this Area
Purchase History
| Date | Buyer | Sale Price | Title Company |
|---|---|---|---|
| Morgan Andrew | -- | Placer Title Company | |
| Morgan Andrew S | $375,000 | Fidelity National Title Co | |
| Naughton Patrick | -- | None Available |
Source: Public Records
Mortgage History
| Date | Status | Borrower | Loan Amount |
|---|---|---|---|
| Open | Morgan Andrew | $548,250 | |
| Closed | Morgan Andrew | $446,000 | |
| Closed | Morgan Andrew | $440,000 | |
| Closed | Morgan Andrew S | $388,300 | |
| Closed | Morgan Andrew S | $380,000 | |
| Closed | Morgan Andrew S | $367,812 | |
| Closed | Morgan Andrew S | $368,207 |
Source: Public Records
Tax History Compared to Growth
Tax History
| Year | Tax Paid | Tax Assessment Tax Assessment Total Assessment is a certain percentage of the fair market value that is determined by local assessors to be the total taxable value of land and additions on the property. | Land | Improvement |
|---|---|---|---|---|
| 2024 | $5,267 | $435,215 | $116,056 | $319,159 |
| 2023 | $5,267 | $426,682 | $113,781 | $312,901 |
| 2022 | $5,185 | $418,316 | $111,550 | $306,766 |
| 2021 | $4,981 | $410,114 | $109,363 | $300,751 |
| 2019 | $4,931 | $397,952 | $106,120 | $291,832 |
| 2018 | $4,758 | $390,150 | $104,040 | $286,110 |
| 2017 | $4,642 | $382,500 | $102,000 | $280,500 |
| 2016 | $4,544 | $375,000 | $30,000 | $345,000 |
| 2015 | $4,491 | $367,810 | $19,871 | $347,939 |
| 2014 | $4,244 | $350,000 | $18,909 | $331,091 |
Source: Public Records
Map
Nearby Homes
- 3001 Oakley Rd
- 2991 Serra Ct
- 3200 E 18th St
- 2955 Almondwood Place
- 2636 Coffee Tree Way
- 3035 Torre Ramel Ln
- 2524 Brazil Ct
- 4525 Goode St
- 4020 Folsom Dr
- 5751 Bridgehead Rd Unit 37
- 5751 Bridgehead Rd
- 4528 Benton St
- 2934 Bluebell Cir
- 4260 Merced Cir
- 0 Oakley Rd
- 4545 Half Dome St
- 4560 Benton St
- 2819 Larkspur Dr
- 4761 Live Oak Ave
- 4149 Folsom Dr