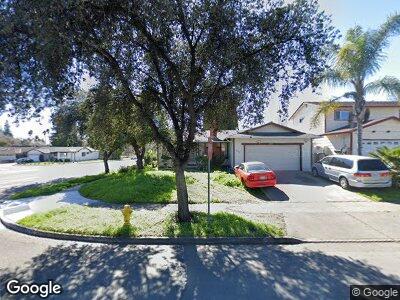
3333 Cropley Ct San Jose, CA 95132
Morrill NeighborhoodEstimated Value: $1,532,690 - $1,731,000
3
Beds
2
Baths
1,228
Sq Ft
$1,320/Sq Ft
Est. Value
About This Home
This home is located at 3333 Cropley Ct, San Jose, CA 95132 and is currently estimated at $1,620,423, approximately $1,319 per square foot. 3333 Cropley Ct is a home located in Santa Clara County with nearby schools including Laneview Elementary School, Morrill Middle School, and Independence High School.
Ownership History
Date
Name
Owned For
Owner Type
Purchase Details
Closed on
Feb 8, 2003
Sold by
Mak Raymond and Mak Jenny
Bought by
Mak Raymond Sui Liang and Mak Jenny Ngun Yin
Current Estimated Value
Create a Home Valuation Report for This Property
The Home Valuation Report is an in-depth analysis detailing your home's value as well as a comparison with similar homes in the area
Home Values in the Area
Average Home Value in this Area
Purchase History
| Date | Buyer | Sale Price | Title Company |
|---|---|---|---|
| Mak Raymond Sui Liang | -- | -- |
Source: Public Records
Tax History Compared to Growth
Tax History
| Year | Tax Paid | Tax Assessment Tax Assessment Total Assessment is a certain percentage of the fair market value that is determined by local assessors to be the total taxable value of land and additions on the property. | Land | Improvement |
|---|---|---|---|---|
| 2023 | $4,242 | $215,267 | $91,385 | $123,882 |
| 2022 | $4,215 | $211,047 | $89,594 | $121,453 |
| 2021 | $4,660 | $206,910 | $87,838 | $119,072 |
| 2020 | $4,427 | $204,790 | $86,938 | $117,852 |
| 2019 | $4,232 | $200,776 | $85,234 | $115,542 |
| 2018 | $4,143 | $196,840 | $83,563 | $113,277 |
| 2017 | $4,129 | $192,981 | $81,925 | $111,056 |
| 2016 | $3,902 | $189,198 | $80,319 | $108,879 |
| 2015 | $3,468 | $186,357 | $79,113 | $107,244 |
| 2014 | $2,967 | $182,708 | $77,564 | $105,144 |
Source: Public Records
Map
Nearby Homes
- 1894 Shilling Ct
- 3516 Lisbon Dr
- 3084 Melchester Dr
- 1784 Newpence Ct
- 3070 Baronscourt Way
- 3659 Madrid Ct
- 1566 Stone Creek Dr
- 3388 Landess Ave Unit A
- 2109 Calle Vista Verde
- 3474 Pine Creek Dr
- 1710 Clear Lake Ave
- 2290 Lynwood Terrace
- 1539 Old Piedmont Rd
- 1430 Danby Ave
- 1881 Grand Teton Dr
- 1810 Mccluhan Way
- 1794 Bethany Ave
- 1079 Hay Ct
- 900 Courtland Ct
- 671 Carlsbad St