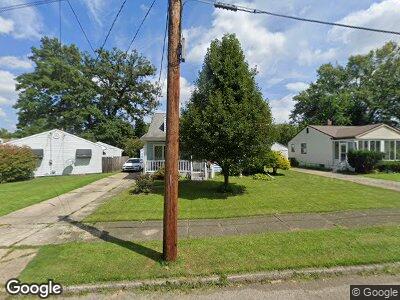
3335 Ambert Ave Youngstown, OH 44502
Buckeye Plat NeighborhoodEstimated Value: $76,063 - $95,000
3
Beds
1
Bath
1,326
Sq Ft
$64/Sq Ft
Est. Value
About This Home
This home is located at 3335 Ambert Ave, Youngstown, OH 44502 and is currently estimated at $85,266, approximately $64 per square foot. 3335 Ambert Ave is a home located in Mahoning County with nearby schools including Paul C. Bunn Elementary School, Chaney High School, and Summit Academy Secondary School - Youngstown.
Ownership History
Date
Name
Owned For
Owner Type
Purchase Details
Closed on
Apr 20, 2022
Bought by
D'Amico Frank R
Current Estimated Value
Home Financials for this Owner
Home Financials are based on the most recent Mortgage that was taken out on this home.
Original Mortgage
$48,840
Interest Rate
3.85%
Mortgage Type
FHA
Purchase Details
Closed on
Apr 4, 2022
Sold by
Ricci-Damico Lois J and Damico Frank R
Bought by
Damico Frank R and Ricci-Damico Lois J
Home Financials for this Owner
Home Financials are based on the most recent Mortgage that was taken out on this home.
Original Mortgage
$48,840
Interest Rate
3.85%
Mortgage Type
FHA
Purchase Details
Closed on
Apr 26, 2006
Sold by
Ricci Damico Lois J
Bought by
Ricci Damico Lois J and Damico Frank R
Home Financials for this Owner
Home Financials are based on the most recent Mortgage that was taken out on this home.
Original Mortgage
$54,700
Interest Rate
6.42%
Mortgage Type
Fannie Mae Freddie Mac
Purchase Details
Closed on
Oct 18, 1984
Bought by
D'Amico Ricci Lois J
Create a Home Valuation Report for This Property
The Home Valuation Report is an in-depth analysis detailing your home's value as well as a comparison with similar homes in the area
Home Values in the Area
Average Home Value in this Area
Purchase History
| Date | Buyer | Sale Price | Title Company |
|---|---|---|---|
| D'Amico Frank R | -- | -- | |
| Damico Frank R | -- | None Listed On Document | |
| Ricci Damico Lois J | -- | None Available | |
| D'Amico Ricci Lois J | -- | -- |
Source: Public Records
Mortgage History
| Date | Status | Borrower | Loan Amount |
|---|---|---|---|
| Open | Damico Frank R | $73,260 | |
| Closed | Damico Frank R | $48,840 | |
| Previous Owner | Ricci Damico Lois J | $54,700 |
Source: Public Records
Tax History Compared to Growth
Tax History
| Year | Tax Paid | Tax Assessment Tax Assessment Total Assessment is a certain percentage of the fair market value that is determined by local assessors to be the total taxable value of land and additions on the property. | Land | Improvement |
|---|---|---|---|---|
| 2024 | $298 | $16,000 | $1,000 | $15,000 |
| 2023 | $325 | $16,000 | $1,000 | $15,000 |
| 2022 | $233 | $12,510 | $1,000 | $11,510 |
| 2021 | $233 | $12,510 | $1,000 | $11,510 |
| 2020 | $235 | $12,510 | $1,000 | $11,510 |
| 2019 | $264 | $12,510 | $1,000 | $11,510 |
| 2018 | $266 | $12,510 | $1,000 | $11,510 |
| 2017 | $272 | $12,510 | $1,000 | $11,510 |
| 2016 | $281 | $13,080 | $1,000 | $12,080 |
| 2015 | $276 | $13,080 | $1,000 | $12,080 |
| 2014 | $274 | $13,080 | $1,000 | $12,080 |
| 2013 | $270 | $13,080 | $1,000 | $12,080 |
Source: Public Records
Map
Nearby Homes
- 1351 E Boston Ave
- 3337 Powers Way
- 3628 Irma St
- 1350 E Florida Ave
- 1146 Detroit Ave
- 3024 Jean St
- 3508 Loveland Rd
- 2675 Hunter Ave
- 2018 S Heights Ave
- 1658 Weston Ave
- 0 Tampa Ave Unit 4420178
- 1533 Weston Ave
- 902 E Boston Ave
- 1641 Medford Ave
- 1605 Medford Ave
- 3515 Lasalle Ave
- 2525 Arkwright Ave
- 1617 Brownlee Ave
- 1559 Wakefield Ave
- 2510 E Midlothian Blvd