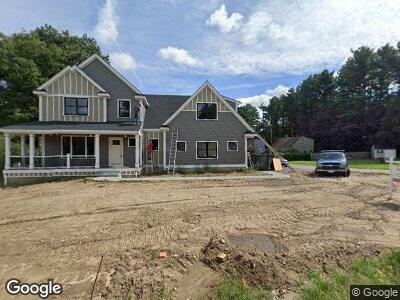
334 North St Walpole, MA 02081
Estimated Value: $1,081,000 - $1,376,000
4
Beds
3
Baths
3,168
Sq Ft
$378/Sq Ft
Est. Value
About This Home
This home is located at 334 North St, Walpole, MA 02081 and is currently estimated at $1,198,693, approximately $378 per square foot. 334 North St is a home located in Norfolk County with nearby schools including Fisher School, Bird Middle School, and Walpole High School.
Create a Home Valuation Report for This Property
The Home Valuation Report is an in-depth analysis detailing your home's value as well as a comparison with similar homes in the area
Home Values in the Area
Average Home Value in this Area
Mortgage History
| Date | Status | Borrower | Loan Amount |
|---|---|---|---|
| Closed | Disipio Joseph | $650,000 | |
| Closed | Disipio Dev Group Llc | $1,066,000 | |
| Closed | Hourihan Paul F | $261,050 | |
| Closed | Hourihan Andrea L | $325,000 | |
| Closed | Hourihan Andrea L | $120,000 | |
| Closed | Hourihan Paul F | $123,750 | |
| Closed | Hourihan Paul F | $43,100 | |
| Closed | Hourihan Paul F | $37,400 |
Source: Public Records
Tax History Compared to Growth
Tax History
| Year | Tax Paid | Tax Assessment Tax Assessment Total Assessment is a certain percentage of the fair market value that is determined by local assessors to be the total taxable value of land and additions on the property. | Land | Improvement |
|---|---|---|---|---|
| 2025 | $14,671 | $1,143,500 | $349,200 | $794,300 |
| 2024 | $9,629 | $728,400 | $335,700 | $392,700 |
| 2023 | $6,795 | $489,200 | $292,000 | $197,200 |
| 2022 | $6,439 | $445,300 | $270,400 | $174,900 |
| 2021 | $6,084 | $410,000 | $255,100 | $154,900 |
| 2020 | $6,062 | $404,400 | $240,700 | $163,700 |
| 2019 | $5,853 | $387,600 | $231,500 | $156,100 |
| 2018 | $5,422 | $355,100 | $223,000 | $132,100 |
| 2017 | $5,240 | $341,800 | $214,400 | $127,400 |
| 2016 | $4,987 | $320,500 | $206,100 | $114,400 |
| 2015 | $4,807 | $306,200 | $196,200 | $110,000 |
| 2014 | $4,671 | $296,400 | $196,200 | $100,200 |
Source: Public Records
Map
Nearby Homes
- 80 Smith Ave
- 59 High St Unit 3 PARCELS
- 15 Helen Ln
- 7 & 8 Gigi's Way
- 318 Fisher St
- 436 High St
- 16 Red Gate Rd
- 881 Main St Unit 4
- 45 Heritage Dr
- 20 Hartshorn Place
- 840 North St
- 3206 Pennington Dr Unit 3206
- 1410 Pennington Dr Unit 1410
- 2402 Pennington Dr Unit 2402
- 8 Litchfields Way
- 8 Chickering Ln
- 26 Bullard St
- 22 Holly Rd
- 979 Main St Unit 6
- 979 Main St Unit 5