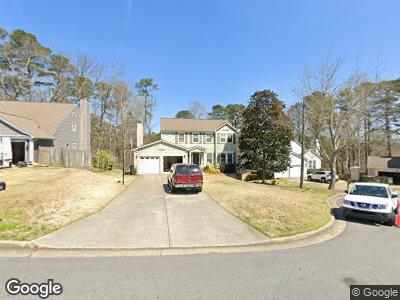
3360 Summer View Dr Alpharetta, GA 30022
Newtown NeighborhoodEstimated Value: $491,000 - $546,150
3
Beds
3
Baths
2,254
Sq Ft
$228/Sq Ft
Est. Value
About This Home
This home is located at 3360 Summer View Dr, Alpharetta, GA 30022 and is currently estimated at $513,038, approximately $227 per square foot. 3360 Summer View Dr is a home located in Fulton County with nearby schools including Northwood Elementary School, Haynes Bridge Middle School, and Centennial High School.
Ownership History
Date
Name
Owned For
Owner Type
Purchase Details
Closed on
Aug 16, 2006
Sold by
Mjs Holdings Llc
Bought by
Weinstein Steven L and Weinstein Chayna B
Current Estimated Value
Home Financials for this Owner
Home Financials are based on the most recent Mortgage that was taken out on this home.
Original Mortgage
$183,200
Interest Rate
6.71%
Mortgage Type
New Conventional
Purchase Details
Closed on
May 23, 2006
Sold by
Sampson David F
Bought by
Mjs Holdings Llc
Home Financials for this Owner
Home Financials are based on the most recent Mortgage that was taken out on this home.
Original Mortgage
$172,500
Interest Rate
6.41%
Purchase Details
Closed on
Apr 25, 2002
Sold by
Sampson David F
Bought by
Sampson David F
Purchase Details
Closed on
Oct 10, 1994
Sold by
Smith Wynne E
Bought by
Sampson David F
Home Financials for this Owner
Home Financials are based on the most recent Mortgage that was taken out on this home.
Original Mortgage
$135,850
Interest Rate
8.48%
Create a Home Valuation Report for This Property
The Home Valuation Report is an in-depth analysis detailing your home's value as well as a comparison with similar homes in the area
Home Values in the Area
Average Home Value in this Area
Purchase History
| Date | Buyer | Sale Price | Title Company |
|---|---|---|---|
| Weinstein Steven L | $229,000 | -- | |
| Mjs Holdings Llc | $163,000 | -- | |
| Sampson David F | -- | -- | |
| Sampson David F | $143,000 | -- |
Source: Public Records
Mortgage History
| Date | Status | Borrower | Loan Amount |
|---|---|---|---|
| Open | Weinstein Chayna B | $175,000 | |
| Closed | Weinstein Chayna B | $60,000 | |
| Closed | Weinstein Chayna B | $171,760 | |
| Closed | Weinstein Steven L | $25,000 | |
| Closed | Weinstein Steven L | $183,200 | |
| Previous Owner | Mjs Holdings Llc | $172,500 | |
| Previous Owner | Sampson David F | $100,000 | |
| Previous Owner | Sampson David F | $82,095 | |
| Previous Owner | Sampson David F | $135,850 |
Source: Public Records
Tax History Compared to Growth
Tax History
| Year | Tax Paid | Tax Assessment Tax Assessment Total Assessment is a certain percentage of the fair market value that is determined by local assessors to be the total taxable value of land and additions on the property. | Land | Improvement |
|---|---|---|---|---|
| 2023 | $5,661 | $200,560 | $43,920 | $156,640 |
| 2022 | $5,175 | $168,640 | $35,640 | $133,000 |
| 2021 | $4,713 | $149,600 | $22,880 | $126,720 |
| 2020 | $4,524 | $140,560 | $25,200 | $115,360 |
| 2019 | $544 | $138,080 | $24,760 | $113,320 |
| 2018 | $4,390 | $134,800 | $24,160 | $110,640 |
| 2017 | $3,503 | $102,920 | $10,960 | $91,960 |
| 2016 | $3,176 | $94,680 | $10,960 | $83,720 |
| 2015 | $3,211 | $94,680 | $10,960 | $83,720 |
| 2014 | $2,273 | $64,440 | $13,280 | $51,160 |
Source: Public Records
Map
Nearby Homes
- 10420 Summer Creek Dr
- 2590 Runic Way
- 10350 Alvin Rd
- 850 Highland Bend Cove
- 3585 Legacy Trace
- 10460 Cranchester Way
- 300 Olmstead Way
- 10440 Cranchester Way Unit 2
- 3150 Berkshire Manor Dr
- 10245 Old Woodland Entry
- 3335 New Heritage Dr
- 10416 Park Walk Point
- 120 Thome Dr
- 315 Stanyan Place
- 1050 Westwell Run
- 10015 Timberstone Rd
- 10215 Alvin Rd
- 645 Crossbridge Alley