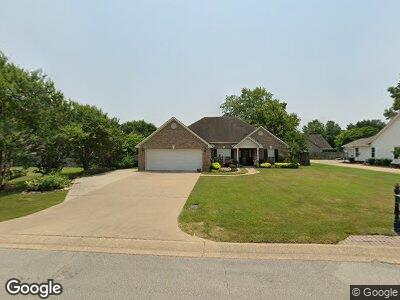
337 Savannah Dr Jonesboro, AR 72404
Estimated Value: $234,151 - $258,000
3
Beds
2
Baths
1,722
Sq Ft
$140/Sq Ft
Est. Value
About This Home
This home is located at 337 Savannah Dr, Jonesboro, AR 72404 and is currently estimated at $241,038, approximately $139 per square foot. 337 Savannah Dr is a home located in Craighead County with nearby schools including Nettleton High School, Concordia Christian Academy, and Montessori School of Jonesboro.
Ownership History
Date
Name
Owned For
Owner Type
Purchase Details
Closed on
Feb 29, 2024
Sold by
Worsham Christina Joan
Bought by
Peterson John and Peterson Linda
Current Estimated Value
Home Financials for this Owner
Home Financials are based on the most recent Mortgage that was taken out on this home.
Original Mortgage
$192,000
Outstanding Balance
$189,713
Interest Rate
6.6%
Mortgage Type
New Conventional
Estimated Equity
$51,325
Purchase Details
Closed on
Aug 13, 2014
Sold by
Fisher Wilma S and Fisher John L
Bought by
Worsham Christina J and Worsham Johnny L
Purchase Details
Closed on
May 7, 2003
Bought by
Smith
Purchase Details
Closed on
May 6, 2002
Bought by
Pack
Purchase Details
Closed on
Apr 19, 2000
Bought by
Crocker
Purchase Details
Closed on
Aug 27, 1999
Bought by
Abel Realty
Purchase Details
Closed on
Oct 7, 1997
Bought by
Abel Realty
Create a Home Valuation Report for This Property
The Home Valuation Report is an in-depth analysis detailing your home's value as well as a comparison with similar homes in the area
Home Values in the Area
Average Home Value in this Area
Purchase History
| Date | Buyer | Sale Price | Title Company |
|---|---|---|---|
| Peterson John | $240,000 | None Listed On Document | |
| Worsham Christina J | $150,000 | Lenders Title | |
| Smith | $143,000 | -- | |
| Pack | $136,000 | -- | |
| Crocker | $133,000 | -- | |
| Abel Realty | -- | -- | |
| Abel Realty | -- | -- |
Source: Public Records
Mortgage History
| Date | Status | Borrower | Loan Amount |
|---|---|---|---|
| Open | Peterson John | $192,000 | |
| Closed | Peterson John | $192,000 |
Source: Public Records
Tax History Compared to Growth
Tax History
| Year | Tax Paid | Tax Assessment Tax Assessment Total Assessment is a certain percentage of the fair market value that is determined by local assessors to be the total taxable value of land and additions on the property. | Land | Improvement |
|---|---|---|---|---|
| 2024 | $1,340 | $36,334 | $5,000 | $31,334 |
| 2023 | $1,340 | $36,334 | $5,000 | $31,334 |
| 2022 | $926 | $36,334 | $5,000 | $31,334 |
| 2021 | $965 | $31,220 | $4,800 | $26,420 |
| 2020 | $965 | $31,220 | $4,800 | $26,420 |
| 2019 | $965 | $31,220 | $4,800 | $26,420 |
| 2018 | $990 | $31,220 | $4,800 | $26,420 |
| 2017 | $990 | $31,220 | $4,800 | $26,420 |
| 2016 | $980 | $27,670 | $4,800 | $22,870 |
| 2015 | $1,330 | $27,670 | $4,800 | $22,870 |
| 2014 | $980 | $27,670 | $4,800 | $22,870 |
Source: Public Records
Map
Nearby Homes
- 341 Savannah Dr
- 403 Brookstone Dr
- 308 Natchez Dr
- 333 Oxford Cove
- 301 Natchez Dr
- 213 Natchez Dr
- 444 Silverstone Dr
- 303 Hunters Ridge Dr
- 400 Whitestone Dr
- lot 6 Block B Mardis
- 506 Whitestone Dr
- 120 Asbury Cove
- 905 Jaxon
- 921 Jaxon
- 738 Sadie
- 603 Old Canyon Rd
- 3719 S Culberhouse St
- 3309 S Culberhouse Rd
- 3723 Plantation Cir
- 3421 Hank Dr