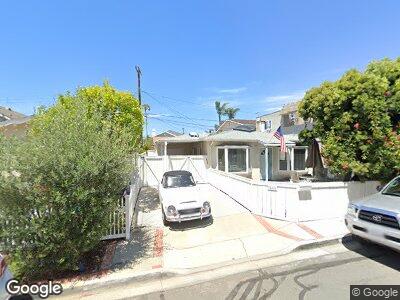
34021 Aurelio Dr Dana Point, CA 92629
Estimated Value: $1,038,519 - $1,319,000
3
Beds
1
Bath
816
Sq Ft
$1,402/Sq Ft
Est. Value
About This Home
This home is located at 34021 Aurelio Dr, Dana Point, CA 92629 and is currently estimated at $1,143,880, approximately $1,401 per square foot. 34021 Aurelio Dr is a home located in Orange County with nearby schools including Richard Henry Dana Elementary School, Marco Forster Middle School, and Dana Hills High School.
Ownership History
Date
Name
Owned For
Owner Type
Purchase Details
Closed on
Dec 1, 2016
Sold by
Rafferty Thomas C
Bought by
Rafferty Thomas Christopher and Thomas Rafferty Trust
Current Estimated Value
Purchase Details
Closed on
Jul 21, 2015
Sold by
Rafferty Thomas C and Rafferty Cheryl A
Bought by
Rafferty Thomas C
Home Financials for this Owner
Home Financials are based on the most recent Mortgage that was taken out on this home.
Original Mortgage
$5,480,345
Interest Rate
4.01%
Mortgage Type
VA
Purchase Details
Closed on
Sep 16, 2002
Sold by
Rafferty Thomas C
Bought by
Rafferty Thomas C and Rafferty Cheryl A
Home Financials for this Owner
Home Financials are based on the most recent Mortgage that was taken out on this home.
Original Mortgage
$186,600
Interest Rate
5.99%
Create a Home Valuation Report for This Property
The Home Valuation Report is an in-depth analysis detailing your home's value as well as a comparison with similar homes in the area
Home Values in the Area
Average Home Value in this Area
Purchase History
| Date | Buyer | Sale Price | Title Company |
|---|---|---|---|
| Rafferty Thomas Christopher | -- | None Available | |
| Rafferty Thomas C | -- | Western Resources Title | |
| Rafferty Thomas C | -- | -- |
Source: Public Records
Mortgage History
| Date | Status | Borrower | Loan Amount |
|---|---|---|---|
| Closed | Rafferty Thomas Christopher | $497,500 | |
| Closed | Rafferty Thomas C | $81,243 | |
| Closed | Rafferty Thomas C | $481,194 | |
| Closed | Rafferty Thomas C | $5,480,345 | |
| Closed | Rafferty Thomas C | $378,750 | |
| Closed | Rafferty Thomas C | $390,000 | |
| Closed | Rafferty Thomas C | $100,000 | |
| Closed | Rafferty Thomas C | $186,200 | |
| Closed | Rafferty Thomas C | $60,000 | |
| Closed | Rafferty Thomas C | $186,600 |
Source: Public Records
Tax History Compared to Growth
Tax History
| Year | Tax Paid | Tax Assessment Tax Assessment Total Assessment is a certain percentage of the fair market value that is determined by local assessors to be the total taxable value of land and additions on the property. | Land | Improvement |
|---|---|---|---|---|
| 2024 | $3,528 | $201,820 | $147,632 | $54,188 |
| 2023 | $3,371 | $197,863 | $144,737 | $53,126 |
| 2022 | $3,201 | $193,984 | $141,899 | $52,085 |
| 2021 | $3,095 | $190,181 | $139,117 | $51,064 |
| 2020 | $2,966 | $188,231 | $137,690 | $50,541 |
| 2019 | $2,897 | $184,541 | $134,991 | $49,550 |
| 2018 | $2,800 | $180,923 | $132,344 | $48,579 |
| 2017 | $2,737 | $177,376 | $129,749 | $47,627 |
| 2016 | $2,613 | $173,899 | $127,205 | $46,694 |
| 2015 | $2,494 | $171,287 | $125,294 | $45,993 |
| 2014 | $2,460 | $167,932 | $122,839 | $45,093 |
Source: Public Records
Map
Nearby Homes
- 34031 Zarzito Dr
- 34055 Alcazar Dr
- 34135 Moongate Ct
- 34208 Pacific Coast Hwy
- 1632 Doheny Way
- 3438 Doheny Way
- 34061 Mazo Dr
- 34031 Silver Lantern St
- 33831 Alcazar Dr Unit 4
- 34052 Mazo Dr
- 33853 Malaga Dr
- 33851 Malaga Dr
- 33781 Copper Lantern St
- 25252 Manzanita Dr
- 24976 Sea Crest Dr
- 24872 Dana Point Dr
- 25442 Sea Bluffs Dr Unit 302
- 24926 Sea Crest Dr
- 25432 Sea Bluffs Dr Unit 302
- 25422 Sea Bluffs Dr Unit 103