NOT LISTED FOR SALE

Estimated Value: $676,000 - $700,000

4 Beds
3 Baths
2,292 Sq Ft
$299/Sq Ft Est. Value

About This Home

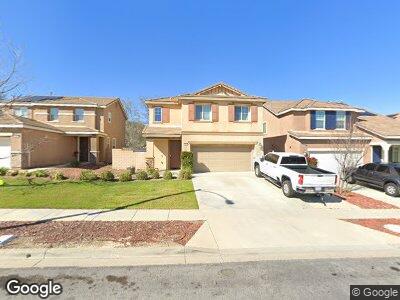
This home is located at 3403 Rosena Ranch Rd, San Bernardino, CA 92407 and is currently estimated at $684,521, approximately $298 per square foot. 3403 Rosena Ranch Rd is a home with nearby schools including Paakuma K-8 and Cajon High School.

Ownership History

Date Name Owned For Owner Type

Purchase Details

Closed on
Nov 18, 2017
Sold by
Sullivan Paul Lee
Bought by
Sullivan Rosalie B

Home Financials for this Owner

Home Financials are based on the most recent Mortgage that was taken out on this home.
Original Mortgage
$397,105
Interest Rate
3.91%
Mortgage Type
New Conventional

Purchase Details

Closed on
Oct 9, 2017
Sold by
Lennar Homes Of California Inc
Bought by
Sullivan Rosalie B and Sullivan Cristian Paul B

Home Financials for this Owner

Home Financials are based on the most recent Mortgage that was taken out on this home.
Original Mortgage
$397,105
Interest Rate
3.91%
Mortgage Type
New Conventional

Purchase Details

Closed on
Aug 9, 2017
Sold by
Lennar Lytle Llc
Bought by
Lennar Homes Of California Inc

Range of Values:

Collateral Analytics

Collateral Analytics Collateral Analytics AVMs (Automated Valuation Model) employ a number of statistical approaches combined with neighborhood-specific comparable selection guarantees the most up-to-date and precise valuations.

Not Available

Collateral Analytics does not have data for the current month. Please view the chart for historical values.

ICE

ICE Mortgage Technology ICE Mortgage Technology’s AVM (Automated Valuation Model) is a state-of-the-art online residential property valuation tool that provides a quick and accurate estimate of the value of almost any home in the U.S.

Not Available

ICE Mortgage Technology does not have data for the current month. Please view the chart for historical values.

First American

First American First American Data & Analytics’ next-generation AVM combines unrivaled data assets with a blended ensemble of valuation models to produce highly accurate, reliable valuations you can trust.

Not Available

First American does not have data for the current month. Please view the chart for historical values.

Quantarium

Quantarium Quantarium’s valuation service, repeatedly proven the industry’s most accurate and comprehensive, is supercharged with a self-learning and auto-tuning AI engine that continually becomes smarter and more accurate as it processes daily inputs from the industry’s leading RE data lake.

Not Available

Quantarium does not have data for the current month. Please view the chart for historical values.

Average Value
Not Available
List Price
Sold Price
Create a Home Valuation Report for This Property
The Home Valuation Report is an in-depth analysis detailing your home's value as well as a comparison with similar homes in the area

Home Values in the Area

Source: Public Records

Average Home Value in this Area


Source: Public Records

Purchase History

Date Buyer Sale Price Title Company
Sullivan Rosalie B -- North American Title Co Inc
Sullivan Rosalie B $418,500 North American Title Company
Lennar Homes Of California Inc -- North American Title Co Inc
Source: Public Records

Mortgage History

Date Status Borrower Loan Amount
Open Sullivan Rosalie B $130,000
Open Sullivan Rosalie B $391,000
Previous Owner Sullivan Rosalie B $397,105
Source: Public Records

Property History

Date Event Price Change Sq Ft Price
04/21/2025 04/21/25 For Sale $685,000 0.0% $299 / Sq Ft
01/11/2025 01/11/25 Off Market $685,000 -- --
12/12/2024 12/12/24 Price Changed $685,000 -2.0% $299 / Sq Ft
11/08/2024 11/08/24 For Sale $698,900 -- $305 / Sq Ft

Tax History Compared to Growth

Source: Public Records

Tax History

Year Tax Paid Tax Assessment Tax Assessment Total Assessment is a certain percentage of the fair market value that is determined by local assessors to be the total taxable value of land and additions on the property. Land Improvement
2024 $8,483 $466,293 $163,203 $303,090
2023 $8,309 $457,150 $160,003 $297,147
2022 $8,319 $448,187 $156,866 $291,321
2021 $8,322 $439,399 $153,790 $285,609
2020 $8,427 $434,893 $152,213 $282,680
2019 $8,302 $426,365 $149,228 $277,137
2018 $8,162 $418,005 $146,302 $271,703
2017 $0 $39,222 $39,222 $0
Source: Public Records

Agents Affiliated with this Home

  • Section Image
See All Agents

Map