


3420 W Center St Anderson, CA 96007
Anderson City Center NeighborhoodEstimated payment $8,655/month
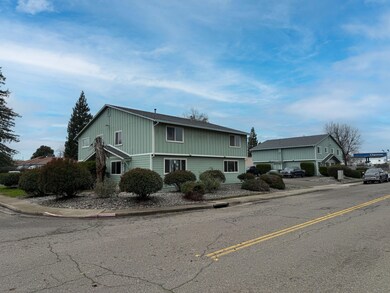
About This Home
Introducing a fantastic multi-family investment opportunity in Anderson, CA. This well maintained multi-family property comprises of eleven (11), 2 bedroom/1 bathroom units and one (1) 3 bedroom/1 bathroom unit, all fully occupied, offering immediate returns for investors. Built in 1977, the property has been fully updated. The project provides Gross Rental Income of just under $157,000 per year, priced at a cap rate of over 6.5%. This opportunity presents an exceptional chance to capitalize on the demand for multi-family investment in the Anderson area. With a strong occupancy rate and attractive cap rate, this investment opportunity offers solid long-term profitability for discerning investors.
Property Details
Home Type
- Multi-Family
Est. Annual Taxes
- $8,410
Year Built
- 1977
Parking
- Off-Street Parking
Home Design
- Wood Siding
Utilities
- Central Air
Listing and Financial Details
- Assessor Parcel Number 202-220-042
Map
Home Values in the Area
Average Home Value in this Area
Tax History
| Year | Tax Paid | Tax Assessment Tax Assessment Total Assessment is a certain percentage of the fair market value that is determined by local assessors to be the total taxable value of land and additions on the property. | Land | Improvement |
|---|---|---|---|---|
| 2024 | $8,410 | $353,476 | $88,366 | $265,110 |
| 2023 | $8,410 | $346,546 | $86,634 | $259,912 |
| 2022 | $8,618 | $341,792 | $84,936 | $256,856 |
| 2021 | $7,777 | $333,091 | $83,271 | $249,820 |
| 2020 | $7,842 | $329,677 | $82,418 | $247,259 |
| 2019 | $8,370 | $323,213 | $80,802 | $242,411 |
| 2018 | $7,638 | $316,876 | $79,218 | $237,658 |
| 2017 | $7,573 | $310,664 | $77,665 | $232,999 |
| 2016 | $7,454 | $304,574 | $76,143 | $228,431 |
| 2015 | $7,600 | $300,000 | $75,000 | $225,000 |
| 2014 | $10,740 | $422,791 | $54,196 | $368,595 |
Property History
| Date | Event | Price | Change | Sq Ft Price |
|---|---|---|---|---|
| 03/02/2025 03/02/25 | Pending | -- | -- | -- |
| 01/24/2025 01/24/25 | For Sale | $1,425,000 | 0.0% | -- |
| 01/13/2025 01/13/25 | Pending | -- | -- | -- |
| 12/31/2024 12/31/24 | For Sale | $1,425,000 | -- | -- |
Deed History
| Date | Type | Sale Price | Title Company |
|---|---|---|---|
| Interfamily Deed Transfer | -- | None Available | |
| Grant Deed | $300,000 | Placer Title Company | |
| Interfamily Deed Transfer | -- | -- |
Mortgage History
| Date | Status | Loan Amount | Loan Type |
|---|---|---|---|
| Open | $500,000 | Unknown | |
| Closed | $50,000 | Commercial | |
| Previous Owner | $300,000 | Commercial |
Source: Shasta Association of REALTORS®
MLS Number: 24-5243
APN: 202-220-042-000
Disclaimer: Certain information contained herein is derived from information provided by parties other than Homes.com. All information provided is deemed reliable, but is not guaranteed to be accurate and should be independently verified.
![]() IDX information is provided exclusively for personal, non-commercial use, and may not be used for any purpose other than to identify prospective properties consumers may be interested in purchasing. Information is deemed reliable but not guaranteed.
IDX information is provided exclusively for personal, non-commercial use, and may not be used for any purpose other than to identify prospective properties consumers may be interested in purchasing. Information is deemed reliable but not guaranteed.
- 3386 Lyndsey Ln
- 1770 Brigman St
- 3383 Nathan Dr
- 2010 Frontier Trail
- 1711 Shasta St
- 0 1st St
- 3065 Silver St
- 1480 1st St
- 1535 Cordova St
- 3612 Rush Landing
- 3525 Paul Dr
- 1730 Ferry St
- 2896 East St
- 1411 Diamond St
- 3241 Cory Ln
- 3554 Cazadero Dr
- 0 Balls Ferry Rd Unit 24-4844
- 2251 South St
- 2750 Martha St
- 2648 Tremonto Rd
