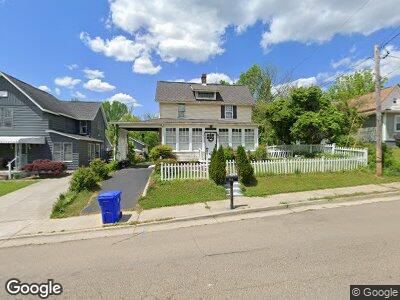
343 Margrave Dr Harriman, TN 37748
Estimated Value: $161,000 - $263,000
--
Bed
3
Baths
2,194
Sq Ft
$98/Sq Ft
Est. Value
About This Home
This home is located at 343 Margrave Dr, Harriman, TN 37748 and is currently estimated at $215,546, approximately $98 per square foot. 343 Margrave Dr is a home located in Roane County with nearby schools including Midtown Elementary School, Kingston Elementary School, and Midway Elementary School.
Ownership History
Date
Name
Owned For
Owner Type
Purchase Details
Closed on
Oct 30, 2006
Sold by
Housing And Urban Developm
Bought by
Sue Fuller Joyce
Current Estimated Value
Home Financials for this Owner
Home Financials are based on the most recent Mortgage that was taken out on this home.
Original Mortgage
$50,000
Outstanding Balance
$30,430
Interest Rate
6.27%
Estimated Equity
$187,586
Purchase Details
Closed on
Apr 13, 2006
Sold by
Barry William N and Barry Jennifer N
Bought by
Housing And Urban Dev
Purchase Details
Closed on
Sep 30, 2003
Purchase Details
Closed on
Jul 21, 2002
Bought by
William Barry and William Jennifer N
Home Financials for this Owner
Home Financials are based on the most recent Mortgage that was taken out on this home.
Original Mortgage
$74,411
Interest Rate
6.52%
Purchase Details
Closed on
Sep 3, 1959
Bought by
Mccluen William Denny Et U Frances
Create a Home Valuation Report for This Property
The Home Valuation Report is an in-depth analysis detailing your home's value as well as a comparison with similar homes in the area
Home Values in the Area
Average Home Value in this Area
Purchase History
| Date | Buyer | Sale Price | Title Company |
|---|---|---|---|
| Sue Fuller Joyce | $50,000 | -- | |
| Housing And Urban Dev | $78,945 | -- | |
| -- | -- | -- | |
| William Barry | $75,000 | -- | |
| Mccluen William Denny Et U Frances | -- | -- |
Source: Public Records
Mortgage History
| Date | Status | Borrower | Loan Amount |
|---|---|---|---|
| Open | Mccluen William Denny Et U Frances | $50,000 | |
| Previous Owner | William Barry | $74,411 |
Source: Public Records
Tax History Compared to Growth
Tax History
| Year | Tax Paid | Tax Assessment Tax Assessment Total Assessment is a certain percentage of the fair market value that is determined by local assessors to be the total taxable value of land and additions on the property. | Land | Improvement |
|---|---|---|---|---|
| 2024 | -- | $31,075 | $1,900 | $29,175 |
| 2023 | $1,066 | $31,075 | $1,900 | $29,175 |
| 2022 | $1,066 | $31,075 | $1,900 | $29,175 |
| 2021 | $1,048 | $31,075 | $1,900 | $29,175 |
| 2020 | $1,086 | $31,075 | $1,900 | $29,175 |
| 2019 | $949 | $25,825 | $1,750 | $24,075 |
| 2018 | $927 | $25,825 | $1,750 | $24,075 |
| 2017 | $927 | $25,825 | $1,750 | $24,075 |
| 2016 | $927 | $25,825 | $1,750 | $24,075 |
| 2015 | $612 | $25,825 | $1,750 | $24,075 |
| 2013 | -- | $25,150 | $1,750 | $23,400 |
Source: Public Records
Map
Nearby Homes
- 512 N Roane St
- 0 N Roane St
- 1106 Oakdale Hwy
- 721 Siluria St
- 725 Chilhowee St
- 613 Short St
- 811 Siluria St
- 722 Trenton St
- 1121 Georgia St
- 316 Morgan Ave NE
- 316 Carter Ave
- 404 Emory Dr
- 229 Walden Ave
- 303 Carter Ave
- 925 N Roane St
- 929 N Roane St
- 108 Ridgewood Rd
- 521 Henderson St
- 432 Queen Ave NE
- 107 & 115 Riggs Chapel Rd