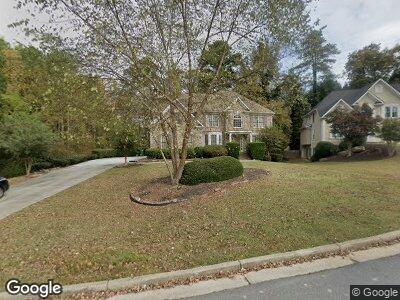
3430 Merganser Ln Alpharetta, GA 30022
Newtown NeighborhoodEstimated Value: $766,735 - $908,000
5
Beds
3
Baths
2,858
Sq Ft
$290/Sq Ft
Est. Value
About This Home
This home is located at 3430 Merganser Ln, Alpharetta, GA 30022 and is currently estimated at $830,184, approximately $290 per square foot. 3430 Merganser Ln is a home located in Fulton County with nearby schools including Barnwell Elementary School, Haynes Bridge Middle School, and Centennial High School.
Ownership History
Date
Name
Owned For
Owner Type
Purchase Details
Closed on
Nov 16, 2007
Sold by
Penn Michael A and Penn Michelle S
Bought by
Wang Deqing and Tang Mei
Current Estimated Value
Home Financials for this Owner
Home Financials are based on the most recent Mortgage that was taken out on this home.
Original Mortgage
$200,000
Interest Rate
6.22%
Mortgage Type
New Conventional
Purchase Details
Closed on
Jul 24, 2001
Sold by
Robert Richardson Homes Inc
Bought by
Penn Michael A and Penn Michelle S
Home Financials for this Owner
Home Financials are based on the most recent Mortgage that was taken out on this home.
Original Mortgage
$160,000
Interest Rate
7.1%
Mortgage Type
New Conventional
Purchase Details
Closed on
May 7, 1996
Sold by
Bridgewater Inc
Bought by
Heritage Homesinc
Create a Home Valuation Report for This Property
The Home Valuation Report is an in-depth analysis detailing your home's value as well as a comparison with similar homes in the area
Home Values in the Area
Average Home Value in this Area
Purchase History
| Date | Buyer | Sale Price | Title Company |
|---|---|---|---|
| Wang Deqing | $435,000 | -- | |
| Penn Michael A | $291,700 | -- | |
| Heritage Homesinc | $42,000 | -- |
Source: Public Records
Mortgage History
| Date | Status | Borrower | Loan Amount |
|---|---|---|---|
| Open | Wang Deqing | $200,000 | |
| Closed | Wang Deqing | $200,000 | |
| Previous Owner | Penn Michael A | $100,000 | |
| Previous Owner | Penn Michael A | $163,000 | |
| Previous Owner | Penn Michael A | $160,000 | |
| Closed | Heritage Homesinc | $0 |
Source: Public Records
Tax History Compared to Growth
Tax History
| Year | Tax Paid | Tax Assessment Tax Assessment Total Assessment is a certain percentage of the fair market value that is determined by local assessors to be the total taxable value of land and additions on the property. | Land | Improvement |
|---|---|---|---|---|
| 2023 | $5,011 | $177,520 | $43,240 | $134,280 |
| 2022 | $4,911 | $177,520 | $43,240 | $134,280 |
| 2021 | $5,146 | $184,920 | $47,720 | $137,200 |
| 2020 | $4,945 | $182,320 | $37,920 | $144,400 |
| 2019 | $0 | $179,080 | $37,240 | $141,840 |
| 2018 | $4,442 | $174,880 | $36,360 | $138,520 |
| 2017 | $4,794 | $153,000 | $38,720 | $114,280 |
| 2016 | $4,716 | $153,000 | $38,720 | $114,280 |
| 2015 | $4,768 | $153,000 | $38,720 | $114,280 |
| 2014 | $4,170 | $131,280 | $33,240 | $98,040 |
Source: Public Records