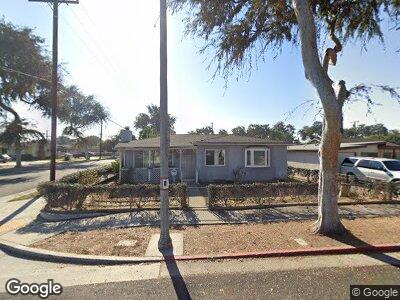
344 E Valencia Dr Fullerton, CA 92832
Estimated Value: $774,425 - $876,000
3
Beds
1
Bath
1,001
Sq Ft
$808/Sq Ft
Est. Value
About This Home
This home is located at 344 E Valencia Dr, Fullerton, CA 92832 and is currently estimated at $809,106, approximately $808 per square foot. 344 E Valencia Dr is a home located in Orange County with nearby schools including Maple Elementary School, Ladera Vista Junior High School, and Fullerton Union High School.
Ownership History
Date
Name
Owned For
Owner Type
Purchase Details
Closed on
May 6, 2009
Sold by
Garcia Rebecca T
Bought by
Morrissey Sea Richard Lloyd and Morrissey Kristi
Current Estimated Value
Home Financials for this Owner
Home Financials are based on the most recent Mortgage that was taken out on this home.
Original Mortgage
$357,525
Outstanding Balance
$234,122
Interest Rate
4.82%
Mortgage Type
VA
Estimated Equity
$588,722
Purchase Details
Closed on
Nov 24, 1993
Sold by
Garcia Rebecca T
Bought by
Garcia Rebecca T
Home Financials for this Owner
Home Financials are based on the most recent Mortgage that was taken out on this home.
Original Mortgage
$50,000
Interest Rate
7.19%
Create a Home Valuation Report for This Property
The Home Valuation Report is an in-depth analysis detailing your home's value as well as a comparison with similar homes in the area
Home Values in the Area
Average Home Value in this Area
Purchase History
| Date | Buyer | Sale Price | Title Company |
|---|---|---|---|
| Morrissey Sea Richard Lloyd | $350,000 | Lawyers Title Company | |
| Garcia Rebecca T | -- | Fidelity National Title Ins |
Source: Public Records
Mortgage History
| Date | Status | Borrower | Loan Amount |
|---|---|---|---|
| Open | Morrissey Sea Richard Lloyd | $357,525 | |
| Previous Owner | Garcia Rebecca T | $125,000 | |
| Previous Owner | Garcia Rebecca T | $43,000 | |
| Previous Owner | Garcia Rebecca T | $21,300 | |
| Previous Owner | Garcia Rebecca T | $55,000 | |
| Previous Owner | Garcia Rebecca T | $50,000 |
Source: Public Records
Tax History Compared to Growth
Tax History
| Year | Tax Paid | Tax Assessment Tax Assessment Total Assessment is a certain percentage of the fair market value that is determined by local assessors to be the total taxable value of land and additions on the property. | Land | Improvement |
|---|---|---|---|---|
| 2024 | $5,105 | $441,870 | $359,591 | $82,279 |
| 2023 | $4,982 | $433,206 | $352,540 | $80,666 |
| 2022 | $4,947 | $424,712 | $345,627 | $79,085 |
| 2021 | $4,862 | $416,385 | $338,850 | $77,535 |
| 2020 | $4,835 | $412,116 | $335,376 | $76,740 |
| 2019 | $4,712 | $404,036 | $328,800 | $75,236 |
| 2018 | $4,641 | $396,114 | $322,353 | $73,761 |
| 2017 | $4,564 | $388,348 | $316,033 | $72,315 |
| 2016 | $4,471 | $380,734 | $309,836 | $70,898 |
| 2015 | $4,347 | $375,016 | $305,182 | $69,834 |
| 2014 | $4,040 | $350,400 | $285,222 | $65,178 |
Source: Public Records
Map
Nearby Homes
- 327 E Ash Ave
- 604 S Newell Ave
- 520 S Lemon St
- 440 E Truslow Ave
- 612 Newkirk Ave
- 15 Pine Viaduct
- 8 Ash Viaduct
- 13 Pine Viaduct
- 13 Palm Viaduct
- 2 Pine Viaduct
- 7 Magnolia Viaduct
- 63 Cherry Viaduct Unit 63
- 121 W Elm Ave
- 130 W Truslow Ave
- 13 Elm Viaduct Unit 13
- 17 Walnut Viaduct
- 5 Walnut Viaduct
- 27 Cypress Viaduct
- 48 Walnut Viaduct
- 57 Maple Viaduct