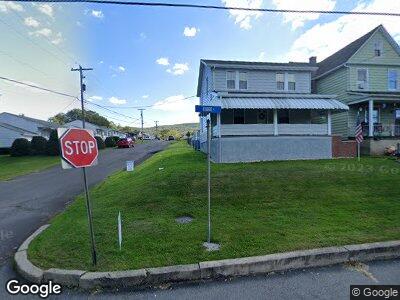
344 Ridge St Unit 46 Hanover Township, PA 18706
Ashley-Wilkes Barre NeighborhoodEstimated Value: $180,258 - $245,000
--
Bed
--
Bath
3,340
Sq Ft
$61/Sq Ft
Est. Value
About This Home
This home is located at 344 Ridge St Unit 46, Hanover Township, PA 18706 and is currently estimated at $204,315, approximately $61 per square foot. 344 Ridge St Unit 46 is a home located in Luzerne County with nearby schools including Lee Park Elementary School, Hanover Area Memorial Elementary School, and Hanover Green Elementary School.
Ownership History
Date
Name
Owned For
Owner Type
Purchase Details
Closed on
May 16, 2016
Sold by
Jones Robert A and Jones Debra S
Bought by
The Robert A & Debra S Jones Family Trus and Jones Debra S
Current Estimated Value
Purchase Details
Closed on
Mar 7, 2008
Sold by
Maddaloni Paul
Bought by
Jones Robert A
Home Financials for this Owner
Home Financials are based on the most recent Mortgage that was taken out on this home.
Original Mortgage
$114,357
Interest Rate
5.72%
Mortgage Type
Purchase Money Mortgage
Purchase Details
Closed on
Oct 5, 2005
Sold by
Fried Judith S
Bought by
Maddaloni Paul
Home Financials for this Owner
Home Financials are based on the most recent Mortgage that was taken out on this home.
Original Mortgage
$94,976
Interest Rate
7.7%
Mortgage Type
Adjustable Rate Mortgage/ARM
Create a Home Valuation Report for This Property
The Home Valuation Report is an in-depth analysis detailing your home's value as well as a comparison with similar homes in the area
Home Values in the Area
Average Home Value in this Area
Purchase History
| Date | Buyer | Sale Price | Title Company |
|---|---|---|---|
| The Robert A & Debra S Jones Family Trus | -- | Attorney | |
| Jones Robert A | $138,000 | None Available | |
| Maddaloni Paul | $118,720 | None Available |
Source: Public Records
Mortgage History
| Date | Status | Borrower | Loan Amount |
|---|---|---|---|
| Open | Jones Robert A | $112,500 | |
| Closed | Jones Robert A | $114,357 | |
| Previous Owner | Maddaloni Paul | $94,976 | |
| Previous Owner | Maddaloni Paul | $23,744 |
Source: Public Records
Tax History Compared to Growth
Tax History
| Year | Tax Paid | Tax Assessment Tax Assessment Total Assessment is a certain percentage of the fair market value that is determined by local assessors to be the total taxable value of land and additions on the property. | Land | Improvement |
|---|---|---|---|---|
| 2025 | $3,351 | $127,000 | $21,500 | $105,500 |
| 2024 | $3,351 | $127,000 | $21,500 | $105,500 |
| 2023 | $3,294 | $127,000 | $21,500 | $105,500 |
| 2022 | $3,270 | $127,000 | $21,500 | $105,500 |
| 2021 | $3,176 | $127,000 | $21,500 | $105,500 |
| 2020 | $3,176 | $127,000 | $21,500 | $105,500 |
| 2019 | $3,083 | $127,000 | $21,500 | $105,500 |
| 2018 | $2,986 | $127,000 | $21,500 | $105,500 |
| 2017 | $2,902 | $127,000 | $21,500 | $105,500 |
| 2016 | -- | $127,000 | $21,500 | $105,500 |
| 2015 | -- | $127,000 | $21,500 | $105,500 |
| 2014 | -- | $127,000 | $21,500 | $105,500 |
Source: Public Records
Map
Nearby Homes