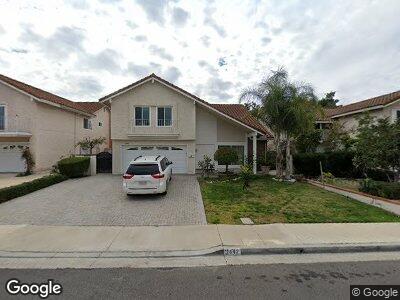
3442 Pecan St Irvine, CA 92606
Walnut NeighborhoodEstimated Value: $1,680,000 - $2,029,233
4
Beds
3
Baths
3,061
Sq Ft
$601/Sq Ft
Est. Value
About This Home
This home is located at 3442 Pecan St, Irvine, CA 92606 and is currently estimated at $1,840,558, approximately $601 per square foot. 3442 Pecan St is a home located in Orange County with nearby schools including College Park Elementary School, Venado Middle School, and Irvine High School.
Ownership History
Date
Name
Owned For
Owner Type
Purchase Details
Closed on
Dec 7, 2015
Sold by
Qiang Xiao and Ming Chen
Bought by
The Xiao Family Revocable Living Trust and Xiao Qiang
Current Estimated Value
Purchase Details
Closed on
Oct 12, 2000
Sold by
Lee Bobby W and Lee Sylvia W
Bought by
Xiao Qiang and Chen Ming
Home Financials for this Owner
Home Financials are based on the most recent Mortgage that was taken out on this home.
Original Mortgage
$300,800
Interest Rate
7.66%
Purchase Details
Closed on
Feb 24, 1994
Sold by
Lee Kuo Sun
Bought by
Lee Mei Hui
Home Financials for this Owner
Home Financials are based on the most recent Mortgage that was taken out on this home.
Original Mortgage
$135,000
Interest Rate
6.25%
Create a Home Valuation Report for This Property
The Home Valuation Report is an in-depth analysis detailing your home's value as well as a comparison with similar homes in the area
Home Values in the Area
Average Home Value in this Area
Purchase History
| Date | Buyer | Sale Price | Title Company |
|---|---|---|---|
| The Xiao Family Revocable Living Trust | -- | None Available | |
| Xiao Qiang | $376,000 | Commonwealth Land Title | |
| Lee Mei Hui | -- | California Counties Title Co |
Source: Public Records
Mortgage History
| Date | Status | Borrower | Loan Amount |
|---|---|---|---|
| Open | Xiao Qiang | $232,000 | |
| Closed | Qiang Xiao | $260,000 | |
| Closed | Xiao Qiang | $311,000 | |
| Closed | Xiao Qiang | $100,000 | |
| Closed | Xiao Qiang | $328,000 | |
| Closed | Xiao Qiang | $350,000 | |
| Closed | Xiao Qiang | $322,700 | |
| Closed | Xiao Qiang | $34,700 | |
| Closed | Xiao Qiang | $334,400 | |
| Closed | Xiao Qiang | $25,600 | |
| Closed | Xiao Qiang | $275,000 | |
| Closed | Xiao Qiang | $85,000 | |
| Previous Owner | Xiao Qiang | $300,800 | |
| Previous Owner | Lee Mei Hui | $135,000 | |
| Closed | Xiao Qiang | $56,400 |
Source: Public Records
Tax History Compared to Growth
Tax History
| Year | Tax Paid | Tax Assessment Tax Assessment Total Assessment is a certain percentage of the fair market value that is determined by local assessors to be the total taxable value of land and additions on the property. | Land | Improvement |
|---|---|---|---|---|
| 2024 | $7,036 | $665,740 | $364,184 | $301,556 |
| 2023 | $6,854 | $652,687 | $357,043 | $295,644 |
| 2022 | $6,721 | $639,890 | $350,042 | $289,848 |
| 2021 | $6,566 | $627,344 | $343,179 | $284,165 |
| 2020 | $6,529 | $620,912 | $339,660 | $281,252 |
| 2019 | $6,383 | $608,738 | $333,000 | $275,738 |
| 2018 | $6,269 | $596,802 | $326,470 | $270,332 |
| 2017 | $6,139 | $585,100 | $320,068 | $265,032 |
| 2016 | $5,716 | $558,690 | $313,792 | $244,898 |
| 2015 | $4,839 | $471,414 | $311,417 | $159,997 |
| 2014 | $4,745 | $462,180 | $305,317 | $156,863 |
Source: Public Records
Map
Nearby Homes
- 14551 Linden Ave
- 20 Nevada
- 114 Saint James Unit 71
- 154 Saint James Unit 53
- 11 Georgia
- 46 Nebraska
- 194 Blue Sky Dr
- 174 Zephyr Run
- 235 Kitty Hawk Ln
- 264 Blue Sky Dr Unit 264
- 369 Deerfield Ave Unit 35
- 68 Night Bloom
- 11 Henry
- 4311 Pioneer St
- 13841 Typee Way
- 4461 Ranchgrove Dr
- 5 Deerwood W
- 13742 Onkayha Cir
- 2325 Dahlia Dr
- 4562 Lockhaven Cir