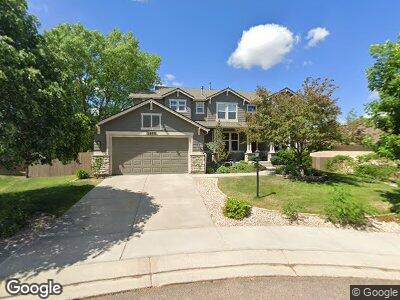
3465 Limber Pine Ct Colorado Springs, CO 80920
Pine Creek NeighborhoodEstimated Value: $736,418 - $863,000
6
Beds
4
Baths
2,812
Sq Ft
$285/Sq Ft
Est. Value
About This Home
This home is located at 3465 Limber Pine Ct, Colorado Springs, CO 80920 and is currently estimated at $802,605, approximately $285 per square foot. 3465 Limber Pine Ct is a home located in El Paso County with nearby schools including Mountain View Elementary School, Challenger Middle School, and Pine Creek High School.
Ownership History
Date
Name
Owned For
Owner Type
Purchase Details
Closed on
May 24, 2019
Sold by
Coffey Lavanson C
Bought by
Coffey Lavanson C and Coffey Jodi Ann
Current Estimated Value
Home Financials for this Owner
Home Financials are based on the most recent Mortgage that was taken out on this home.
Original Mortgage
$400,000
Interest Rate
4.2%
Mortgage Type
VA
Purchase Details
Closed on
Jun 9, 2006
Sold by
Stump John E and Stump Chien Chi Hong
Bought by
Coffey Lavanson C
Home Financials for this Owner
Home Financials are based on the most recent Mortgage that was taken out on this home.
Original Mortgage
$356,000
Interest Rate
6.37%
Mortgage Type
Fannie Mae Freddie Mac
Purchase Details
Closed on
Dec 22, 2003
Sold by
Keller Homes Inc
Bought by
Stump John E and Stump Chien Chi Hong
Home Financials for this Owner
Home Financials are based on the most recent Mortgage that was taken out on this home.
Original Mortgage
$298,405
Interest Rate
6.02%
Mortgage Type
Unknown
Create a Home Valuation Report for This Property
The Home Valuation Report is an in-depth analysis detailing your home's value as well as a comparison with similar homes in the area
Home Values in the Area
Average Home Value in this Area
Purchase History
| Date | Buyer | Sale Price | Title Company |
|---|---|---|---|
| Coffey Lavanson C | -- | None Available | |
| Coffey Lavanson C | $445,000 | Fahtco | |
| Stump John E | $373,007 | Land Title |
Source: Public Records
Mortgage History
| Date | Status | Borrower | Loan Amount |
|---|---|---|---|
| Open | Coffey Lavanson C | $392,000 | |
| Closed | Coffey Lavanson C | $400,000 | |
| Closed | Coffey Lavanson C | $353,000 | |
| Closed | Coffey Lavanson C | $356,000 | |
| Previous Owner | Stump John E | $298,405 |
Source: Public Records
Tax History Compared to Growth
Tax History
| Year | Tax Paid | Tax Assessment Tax Assessment Total Assessment is a certain percentage of the fair market value that is determined by local assessors to be the total taxable value of land and additions on the property. | Land | Improvement |
|---|---|---|---|---|
| 2024 | $2,881 | $51,850 | $7,710 | $44,140 |
| 2022 | $2,601 | $39,310 | $7,690 | $31,620 |
| 2021 | $2,891 | $40,450 | $7,920 | $32,530 |
| 2020 | $2,892 | $37,570 | $6,330 | $31,240 |
| 2019 | $2,861 | $37,570 | $6,330 | $31,240 |
| 2018 | $2,930 | $37,800 | $5,800 | $32,000 |
| 2017 | $2,919 | $37,800 | $5,800 | $32,000 |
| 2016 | $2,970 | $38,420 | $5,960 | $32,460 |
| 2015 | $2,965 | $38,420 | $5,960 | $32,460 |
| 2014 | $2,799 | $36,250 | $5,960 | $30,290 |
Source: Public Records
Map
Nearby Homes
- 3351 Promontory Peak Dr
- 10632 Leadville Creek Point
- 10624 Ouray Creek Point
- 3654 Tuscanna Grove
- 3622 Tuscanna Grove
- 9969 Rose Leaf Ct
- 3060 Kettle Ridge Dr
- 10835 Tincup Creek Point
- 10833 Creede Creek Point
- 3103 Summer Rain Trail
- 3242 Cloudy Sky Heights
- 4007 Notch Trail
- 3265 Bewildering Heights
- 10006 Buck Gulch Ct
- 10715 Rhinestone Dr
- 10035 Buck Gulch Ct
- 10868 Rolling Cloud Dr
- 10725 Black Elk Way
- 10083 Crews Gulch Ct
- 10724 Black Elk Way