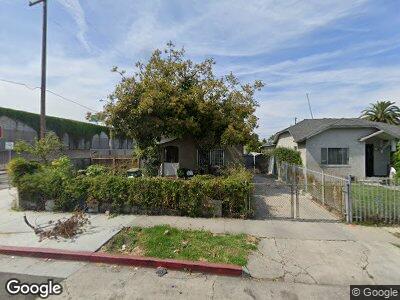
347 W 84th St Los Angeles, CA 90003
Florence NeighborhoodEstimated Value: $491,000 - $664,000
2
Beds
1
Bath
1,100
Sq Ft
$539/Sq Ft
Est. Value
About This Home
This home is located at 347 W 84th St, Los Angeles, CA 90003 and is currently estimated at $592,624, approximately $538 per square foot. 347 W 84th St is a home located in Los Angeles County with nearby schools including Dr. Owen Lloyd Knox Elementary School, Mary McLeod Bethune Middle School, and Academy For Multiligual Arts And Science At Mervyn M. Dymally High.
Ownership History
Date
Name
Owned For
Owner Type
Purchase Details
Closed on
Dec 8, 2017
Sold by
Esquer Jesse Ricardo and Esquer Jesse R
Bought by
Sherlock Robert D
Current Estimated Value
Home Financials for this Owner
Home Financials are based on the most recent Mortgage that was taken out on this home.
Original Mortgage
$228,681
Interest Rate
4.5%
Mortgage Type
FHA
Purchase Details
Closed on
Dec 7, 2017
Sold by
Sherlock Robert D
Bought by
Macias Raul D
Home Financials for this Owner
Home Financials are based on the most recent Mortgage that was taken out on this home.
Original Mortgage
$228,681
Interest Rate
4.5%
Mortgage Type
FHA
Purchase Details
Closed on
Feb 18, 2010
Sold by
Sherlock Robert D
Bought by
Sherlock Robert D
Purchase Details
Closed on
Nov 12, 2002
Sold by
Esquer Jesse R
Bought by
Esquer Jesse R and The Jesse R Esquer Separate Property Tr
Create a Home Valuation Report for This Property
The Home Valuation Report is an in-depth analysis detailing your home's value as well as a comparison with similar homes in the area
Home Values in the Area
Average Home Value in this Area
Purchase History
| Date | Buyer | Sale Price | Title Company |
|---|---|---|---|
| Macias Raul D | $233,000 | Fidelity National Title Comp | |
| Sherlock Robert D | -- | None Available | |
| Esquer Jesse R | -- | -- |
Source: Public Records
Mortgage History
| Date | Status | Borrower | Loan Amount |
|---|---|---|---|
| Open | Maclas Raul D | $290,000 | |
| Previous Owner | Macias Raul D | $228,681 |
Source: Public Records
Tax History Compared to Growth
Tax History
| Year | Tax Paid | Tax Assessment Tax Assessment Total Assessment is a certain percentage of the fair market value that is determined by local assessors to be the total taxable value of land and additions on the property. | Land | Improvement |
|---|---|---|---|---|
| 2024 | $5,042 | $401,581 | $281,107 | $120,474 |
| 2023 | $4,946 | $393,708 | $275,596 | $118,112 |
| 2022 | $4,717 | $385,990 | $270,193 | $115,797 |
| 2021 | $4,657 | $378,423 | $264,896 | $113,527 |
| 2019 | $4,519 | $367,200 | $257,040 | $110,160 |
| 2018 | $2,401 | $187,179 | $139,536 | $47,643 |
| 2016 | $2,286 | $179,912 | $134,118 | $45,794 |
| 2015 | $2,254 | $177,211 | $132,104 | $45,107 |
| 2014 | $2,271 | $173,741 | $129,517 | $44,224 |
Source: Public Records
Map
Nearby Homes