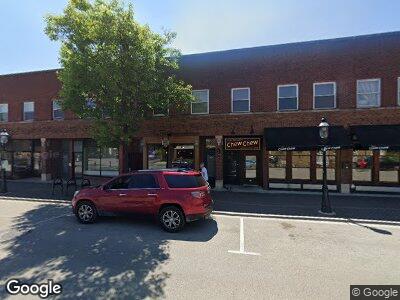
35 E Burlington St Unit 2 Riverside, IL 60546
Estimated Value: $204,000 - $221,000
2
Beds
1
Bath
1,000
Sq Ft
$212/Sq Ft
Est. Value
About This Home
This home is located at 35 E Burlington St Unit 2, Riverside, IL 60546 and is currently estimated at $212,043, approximately $212 per square foot. 35 E Burlington St Unit 2 is a home located in Cook County with nearby schools including Central Elementary School, L J Hauser Jr High School, and Riverside Brookfield High School.
Ownership History
Date
Name
Owned For
Owner Type
Purchase Details
Closed on
Jun 20, 2024
Sold by
Froio Antonietta
Bought by
Gangemi Antonio
Current Estimated Value
Purchase Details
Closed on
Feb 27, 2024
Sold by
Ferenac Steve and Ferenac Biserka
Bought by
Froio Antonietta
Create a Home Valuation Report for This Property
The Home Valuation Report is an in-depth analysis detailing your home's value as well as a comparison with similar homes in the area
Home Values in the Area
Average Home Value in this Area
Purchase History
| Date | Buyer | Sale Price | Title Company |
|---|---|---|---|
| Gangemi Antonio | -- | None Listed On Document | |
| Froio Antonietta | $200,000 | None Listed On Document |
Source: Public Records
Mortgage History
| Date | Status | Borrower | Loan Amount |
|---|---|---|---|
| Previous Owner | Ferenac Steve | $45,000 |
Source: Public Records
Tax History Compared to Growth
Tax History
| Year | Tax Paid | Tax Assessment Tax Assessment Total Assessment is a certain percentage of the fair market value that is determined by local assessors to be the total taxable value of land and additions on the property. | Land | Improvement |
|---|---|---|---|---|
| 2024 | $2,769 | $21,000 | $1,184 | $19,816 |
| 2023 | $2,769 | $21,000 | $1,184 | $19,816 |
| 2022 | $2,769 | $10,649 | $1,530 | $9,119 |
| 2021 | $2,693 | $10,648 | $1,530 | $9,118 |
| 2020 | $2,686 | $10,648 | $1,530 | $9,118 |
| 2019 | $2,558 | $10,696 | $1,386 | $9,310 |
| 2018 | $2,480 | $10,696 | $1,386 | $9,310 |
| 2017 | $2,420 | $10,696 | $1,386 | $9,310 |
| 2016 | $2,607 | $9,900 | $1,155 | $8,745 |
| 2015 | $2,504 | $9,900 | $1,155 | $8,745 |
| 2014 | $5,084 | $17,601 | $1,155 | $16,446 |
| 2013 | $6,417 | $25,078 | $1,155 | $23,923 |
Source: Public Records
Map
Nearby Homes
- 59 E Quincy St
- 50 Forest Ave Unit 2S
- 141 E Quincy St
- 130 Michaux Rd
- 100 Pine Ave Unit 3
- 116 Forest Ave
- 50 West Ave Unit 1N
- 50 West Ave Unit 1S
- 177 Michaux Rd
- 192 E Burlington St
- 129 Barrypoint Rd
- 8 West Ave
- 141 Scottswood Rd
- 261 Herrick Rd
- 225 Maplewood Rd
- 172 Barrypoint Rd
- 221 Akenside Rd
- 253 Olmsted Rd
- 208 Fairbank Rd
- 320 Herrick Rd