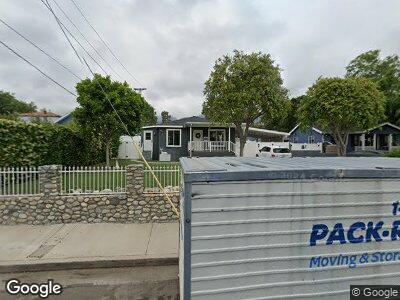
35 E Calaveras St Altadena, CA 91001
Estimated Value: $790,000 - $883,000
2
Beds
1
Bath
700
Sq Ft
$1,185/Sq Ft
Est. Value
About This Home
This home is located at 35 E Calaveras St, Altadena, CA 91001 and is currently estimated at $829,436, approximately $1,184 per square foot. 35 E Calaveras St is a home located in Los Angeles County with nearby schools including Altadena Arts Magnet Elementary, Charles W. Eliot Arts Magnet Academy, and John Muir High School.
Ownership History
Date
Name
Owned For
Owner Type
Purchase Details
Closed on
Sep 2, 2016
Sold by
Lopez Antonio
Bought by
Garcia Juan Carlos Ruiz and Lopez Esther B
Current Estimated Value
Purchase Details
Closed on
Nov 21, 2005
Sold by
Lopez Esther B
Bought by
Lopez Antonio
Home Financials for this Owner
Home Financials are based on the most recent Mortgage that was taken out on this home.
Original Mortgage
$469,342
Interest Rate
5.86%
Mortgage Type
FHA
Purchase Details
Closed on
Jul 17, 2002
Sold by
Lopez Antonio and Lopez Maria
Bought by
Lopez Esther B
Home Financials for this Owner
Home Financials are based on the most recent Mortgage that was taken out on this home.
Original Mortgage
$75,000
Interest Rate
6.7%
Purchase Details
Closed on
Nov 20, 2001
Sold by
Lopez Antonio and Lopez Maria
Bought by
Lopez Antonio
Create a Home Valuation Report for This Property
The Home Valuation Report is an in-depth analysis detailing your home's value as well as a comparison with similar homes in the area
Home Values in the Area
Average Home Value in this Area
Purchase History
| Date | Buyer | Sale Price | Title Company |
|---|---|---|---|
| Garcia Juan Carlos Ruiz | -- | None Available | |
| Lopez Antonio | -- | Alliance Title Company | |
| Lopez Esther B | -- | Fidelity National Title | |
| Lopez Antonio | -- | Chicago Title |
Source: Public Records
Mortgage History
| Date | Status | Borrower | Loan Amount |
|---|---|---|---|
| Closed | Garcia Juan Carlos Ruiz | $375,000 | |
| Closed | Lopez Antonio | $469,342 | |
| Closed | Lopez Esther B | $75,000 |
Source: Public Records
Tax History Compared to Growth
Tax History
| Year | Tax Paid | Tax Assessment Tax Assessment Total Assessment is a certain percentage of the fair market value that is determined by local assessors to be the total taxable value of land and additions on the property. | Land | Improvement |
|---|---|---|---|---|
| 2024 | $1,112 | $45,923 | $20,938 | $24,985 |
| 2023 | $1,062 | $45,024 | $20,528 | $24,496 |
| 2022 | $1,033 | $44,142 | $20,126 | $24,016 |
| 2021 | $965 | $43,278 | $19,732 | $23,546 |
| 2019 | $939 | $41,997 | $19,148 | $22,849 |
| 2018 | $824 | $41,174 | $18,773 | $22,401 |
| 2016 | $787 | $39,577 | $18,045 | $21,532 |
| 2015 | $777 | $38,983 | $17,774 | $21,209 |
| 2014 | $778 | $38,220 | $17,426 | $20,794 |
Source: Public Records
Map
Nearby Homes
- 56 La Venezia Ct
- 105 E Calaveras St
- 2415 Fair Oaks Ave
- 105 Ventura St
- 35 W Mariposa St
- 43 W Mariposa St
- 225 E Mariposa St
- 2669 Glen Ave
- 3249 N Marengo Ave
- 121 W Terrace St
- 41 E Altadena Dr
- 283 W Calaveras St
- 16 W Pine St
- 2469 Grandeur Ave
- 309 Mountain View St
- 400 E Calaveras St
- 2637 N Olive Ave
- 366 W Harriet St
- 345 Figueroa Dr
- 254 E Pentagon St