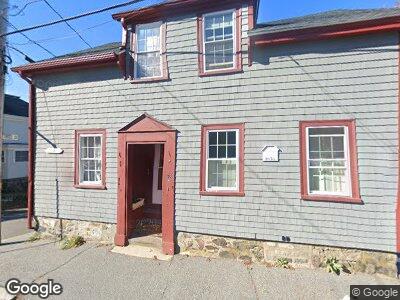
35 Rowland St Marblehead, MA 01945
Estimated Value: $813,000 - $842,000
4
Beds
2
Baths
1,570
Sq Ft
$528/Sq Ft
Est. Value
About This Home
This home is located at 35 Rowland St, Marblehead, MA 01945 and is currently estimated at $829,500, approximately $528 per square foot. 35 Rowland St is a home located in Essex County with nearby schools including Marblehead High School, Marblehead Community Charter Public School, and Devereux School.
Ownership History
Date
Name
Owned For
Owner Type
Purchase Details
Closed on
Jul 1, 2013
Sold by
Rowland Street Rt
Bought by
Pappas Peter M
Current Estimated Value
Home Financials for this Owner
Home Financials are based on the most recent Mortgage that was taken out on this home.
Original Mortgage
$325,200
Interest Rate
3.51%
Mortgage Type
New Conventional
Create a Home Valuation Report for This Property
The Home Valuation Report is an in-depth analysis detailing your home's value as well as a comparison with similar homes in the area
Home Values in the Area
Average Home Value in this Area
Purchase History
| Date | Buyer | Sale Price | Title Company |
|---|---|---|---|
| Pappas Peter M | $433,600 | -- |
Source: Public Records
Mortgage History
| Date | Status | Borrower | Loan Amount |
|---|---|---|---|
| Open | Murtagh Declan S | $626,250 | |
| Closed | Murtagh Declan S | $626,250 | |
| Closed | Pappas Peter M | $325,200 |
Source: Public Records
Tax History Compared to Growth
Tax History
| Year | Tax Paid | Tax Assessment Tax Assessment Total Assessment is a certain percentage of the fair market value that is determined by local assessors to be the total taxable value of land and additions on the property. | Land | Improvement |
|---|---|---|---|---|
| 2025 | $7,134 | $788,300 | $515,900 | $272,400 |
| 2024 | $7,294 | $814,100 | $561,700 | $252,400 |
| 2023 | $6,349 | $634,900 | $435,600 | $199,300 |
| 2022 | $6,156 | $585,200 | $372,600 | $212,600 |
| 2021 | $5,679 | $545,000 | $332,400 | $212,600 |
| 2020 | $5,769 | $555,200 | $378,300 | $176,900 |
| 2019 | $5,347 | $497,900 | $321,000 | $176,900 |
| 2018 | $5,360 | $486,400 | $309,500 | $176,900 |
| 2017 | $5,103 | $463,500 | $286,600 | $176,900 |
| 2016 | $4,915 | $442,800 | $263,700 | $179,100 |
| 2015 | $4,801 | $433,300 | $252,200 | $181,100 |
| 2014 | $3,818 | $344,300 | $229,300 | $115,000 |
Source: Public Records
Map
Nearby Homes
- 49 Atlantic Ave
- 43 Sewall St Unit 2
- 39 Village St
- 19 Middle St
- 218 Washington St Unit 5
- 16 Waldron Ct
- 61 Brackett Place Unit C
- 61 Brackett Place Unit B
- 83 Pleasant St Unit 5
- 23 Gregory St
- 55 Brackett Place Unit B
- 20 Girdler Rd
- 36 Wharf Path
- 125 Elm St Unit A
- 17 Taft St
- 3 Lincoln Ave
- 197A W Shore Dr Unit A
- 34 Mugford St
- 75 Cornell Rd
- 42 Locust St