Estimated Value: $364,000 - $511,000
--
Bed
2
Baths
894
Sq Ft
$496/Sq Ft
Est. Value
About This Home
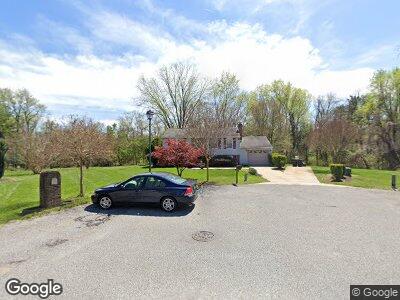
This home is located at 3500 Ripplingbrook Ct, Bowie, MD 20721 and is currently estimated at $443,672, approximately $496 per square foot. 3500 Ripplingbrook Ct is a home located in Prince George's County with nearby schools including Ardmore Elementary School, Ernest Everett Just Middle, and Charles Herbert Flowers High School.
Ownership History
Date
Name
Owned For
Owner Type
Purchase Details
Closed on
Oct 3, 1991
Sold by
Taylor Rachel W
Bought by
Edwards Miller A
Current Estimated Value
Create a Home Valuation Report for This Property
The Home Valuation Report is an in-depth analysis detailing your home's value as well as a comparison with similar homes in the area
Home Values in the Area
Average Home Value in this Area
Purchase History
| Date | Buyer | Sale Price | Title Company |
|---|---|---|---|
| Edwards Miller A | $133,000 | -- |
Source: Public Records
Mortgage History
| Date | Status | Borrower | Loan Amount |
|---|---|---|---|
| Open | Edward Miller A | $107,500 |
Source: Public Records
Tax History Compared to Growth
Tax History
| Year | Tax Paid | Tax Assessment Tax Assessment Total Assessment is a certain percentage of the fair market value that is determined by local assessors to be the total taxable value of land and additions on the property. | Land | Improvement |
|---|---|---|---|---|
| 2024 | $5,345 | $332,833 | $0 | $0 |
| 2023 | $4,499 | $276,000 | $106,400 | $169,600 |
| 2022 | $3,002 | $270,000 | $0 | $0 |
| 2021 | $5,068 | $264,000 | $0 | $0 |
| 2020 | $4,232 | $258,000 | $73,200 | $184,800 |
| 2019 | $4,132 | $251,267 | $0 | $0 |
| 2018 | $4,385 | $244,533 | $0 | $0 |
| 2017 | $4,192 | $237,800 | $0 | $0 |
| 2016 | -- | $217,333 | $0 | $0 |
| 2015 | $3,936 | $196,867 | $0 | $0 |
| 2014 | $3,936 | $176,400 | $0 | $0 |
Source: Public Records
Map
Nearby Homes
- 10600 Parrish Ln
- 3302 Meadowridge Place
- 3520 Golden Hill Dr
- 3506 Golden Hill Dr
- 3902 Kencrest Ct
- 9808 Bald Hill Rd
- 10401 Cleary Ln
- 4016 Ayden Ct
- 9905 Rosa Vista Ct
- 4106 Lavender Ln
- 3044 Mia Ln
- 9903 Quiet Glen Ct
- 2802 Berrywood Ln
- 3007 Saint Josephs Dr
- 4714 Morning Glory Trail
- 4309 Windflower Way
- 4240 Glenn Dale Rd
- 11121 Superior Landing
- 11701 Locust Dale Ct
- 2510 Huntley Ct