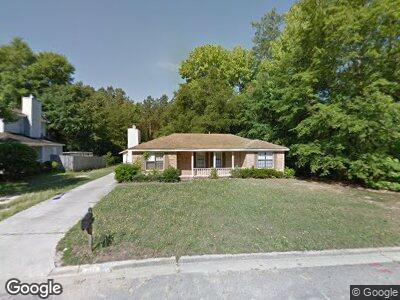
3503 Northpines Dr Augusta, GA 30906
Estimated Value: $202,793 - $236,000
4
Beds
2
Baths
1,862
Sq Ft
$122/Sq Ft
Est. Value
About This Home
This home is located at 3503 Northpines Dr, Augusta, GA 30906 and is currently estimated at $227,448, approximately $122 per square foot. 3503 Northpines Dr is a home located in Richmond County with nearby schools including Gracewood Elementary School, Pine Hill Middle School, and Johnson Magnet.
Ownership History
Date
Name
Owned For
Owner Type
Purchase Details
Closed on
Nov 29, 2011
Sold by
Secretary Of Housing And U
Bought by
Brunson Jack and Brunson Louminta
Current Estimated Value
Home Financials for this Owner
Home Financials are based on the most recent Mortgage that was taken out on this home.
Original Mortgage
$36,640
Interest Rate
4.06%
Purchase Details
Closed on
Nov 2, 2010
Sold by
Wells Fargo Bk Na
Bought by
Hud & Housing Of Urban Dev
Purchase Details
Closed on
Jun 26, 2006
Sold by
Haskell Randall C
Bought by
Wrease Debra F
Home Financials for this Owner
Home Financials are based on the most recent Mortgage that was taken out on this home.
Original Mortgage
$119,059
Interest Rate
6.57%
Purchase Details
Closed on
Apr 1, 1987
Sold by
Hephzibah Homes Inc
Bought by
Haskell Randall C
Create a Home Valuation Report for This Property
The Home Valuation Report is an in-depth analysis detailing your home's value as well as a comparison with similar homes in the area
Home Values in the Area
Average Home Value in this Area
Purchase History
| Date | Buyer | Sale Price | Title Company |
|---|---|---|---|
| Brunson Jack | $45,800 | -- | |
| Hud & Housing Of Urban Dev | -- | -- | |
| Wells Fargo Bk Na | $126,092 | -- | |
| Wrease Debra F | $120,000 | None Available | |
| Haskell Randall C | $55,200 | -- |
Source: Public Records
Mortgage History
| Date | Status | Borrower | Loan Amount |
|---|---|---|---|
| Open | Brunson Jack | $25,000 | |
| Closed | Brunson Jack | $36,640 | |
| Previous Owner | Wrease Debra F | $119,059 | |
| Previous Owner | Wrease Debra F | $4,500 | |
| Previous Owner | Wrease Debra F | $2,000 | |
| Previous Owner | Wrease Debra F | $2,500 | |
| Previous Owner | Haskell Randall C | $112,500 | |
| Previous Owner | Haskell Randall C | $110,763 |
Source: Public Records
Tax History Compared to Growth
Tax History
| Year | Tax Paid | Tax Assessment Tax Assessment Total Assessment is a certain percentage of the fair market value that is determined by local assessors to be the total taxable value of land and additions on the property. | Land | Improvement |
|---|---|---|---|---|
| 2024 | $1,072 | $84,572 | $5,200 | $79,372 |
| 2023 | $1,072 | $76,856 | $5,200 | $71,656 |
| 2022 | $988 | $62,190 | $5,200 | $56,990 |
| 2021 | $855 | $44,579 | $5,200 | $39,379 |
| 2020 | $860 | $44,579 | $5,200 | $39,379 |
| 2019 | $893 | $44,579 | $5,200 | $39,379 |
| 2018 | $897 | $44,579 | $5,200 | $39,379 |
| 2017 | $1,793 | $44,579 | $5,200 | $39,379 |
| 2016 | $1,794 | $44,579 | $5,200 | $39,379 |
| 2015 | $1,806 | $44,579 | $5,200 | $39,379 |
| 2014 | $1,808 | $44,579 | $5,200 | $39,379 |
Source: Public Records
Map
Nearby Homes
- 1828 N Barton Dr
- 3522 Northpines Dr
- 2103 Pepperidge Dr
- 1822 Covington Place
- 3433 Winesap Way
- 2104 Oak Leaf Way
- 1803 Covington Place
- 3818 Beacon Dr
- 1704 Apple Valley Dr
- 1909 Neptune Dr
- 1626 Apple Valley Dr
- 2140 Pepperidge Dr
- 3342 Fashion Dr
- 3801 Clanton Rd
- 3591 Jonathan Cir
- 3534 Stoney Brook Rd
- 3585 Jonathan Cir
- 3554 Jonathan Cir
- 3819 Clanton Rd
- 3609 Bitternut St