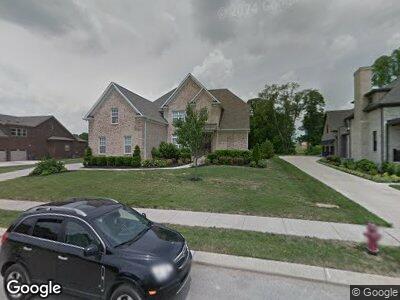
3516 Robbins Nest Rd Thompsons Station, TN 37179
Estimated Value: $1,025,706 - $1,168,000
--
Bed
1
Bath
3,208
Sq Ft
$340/Sq Ft
Est. Value
About This Home
This home is located at 3516 Robbins Nest Rd, Thompsons Station, TN 37179 and is currently estimated at $1,091,427, approximately $340 per square foot. 3516 Robbins Nest Rd is a home located in Williamson County with nearby schools including Thompson's Station Middle School and Summit High School.
Ownership History
Date
Name
Owned For
Owner Type
Purchase Details
Closed on
Mar 18, 2011
Sold by
Alex Gregg Construction Llc
Bought by
Miller Jonathan S and Miller Amelia P
Current Estimated Value
Home Financials for this Owner
Home Financials are based on the most recent Mortgage that was taken out on this home.
Original Mortgage
$383,800
Interest Rate
4.87%
Mortgage Type
FHA
Purchase Details
Closed on
Aug 26, 2010
Sold by
Regions Bank
Bought by
Alex Gregg Construction Llc
Home Financials for this Owner
Home Financials are based on the most recent Mortgage that was taken out on this home.
Original Mortgage
$322,400
Interest Rate
4.61%
Mortgage Type
Commercial
Purchase Details
Closed on
Jun 10, 2010
Sold by
Atkins & Associates Homebuilders Inc
Bought by
Regions Bank
Create a Home Valuation Report for This Property
The Home Valuation Report is an in-depth analysis detailing your home's value as well as a comparison with similar homes in the area
Home Values in the Area
Average Home Value in this Area
Purchase History
| Date | Buyer | Sale Price | Title Company |
|---|---|---|---|
| Miller Jonathan S | $405,000 | Mid State Title & Escrow Inc | |
| Alex Gregg Construction Llc | $75,000 | Mid State Title & Escrow Inc | |
| Regions Bank | $381,640 | None Available |
Source: Public Records
Mortgage History
| Date | Status | Borrower | Loan Amount |
|---|---|---|---|
| Open | Miller Jonathan S | $300,000 | |
| Closed | Miller Jonathan S | $388,500 | |
| Closed | Miller Jonathan S | $383,800 | |
| Previous Owner | Alex Gregg Construction Llc | $322,400 |
Source: Public Records
Tax History Compared to Growth
Tax History
| Year | Tax Paid | Tax Assessment Tax Assessment Total Assessment is a certain percentage of the fair market value that is determined by local assessors to be the total taxable value of land and additions on the property. | Land | Improvement |
|---|---|---|---|---|
| 2024 | $3,055 | $154,050 | $48,750 | $105,300 |
| 2023 | $3,055 | $154,050 | $48,750 | $105,300 |
| 2022 | $3,055 | $154,050 | $48,750 | $105,300 |
| 2021 | $3,055 | $154,050 | $48,750 | $105,300 |
| 2020 | $3,002 | $129,250 | $35,000 | $94,250 |
| 2019 | $3,002 | $129,250 | $35,000 | $94,250 |
| 2018 | $2,912 | $129,250 | $35,000 | $94,250 |
| 2017 | $2,886 | $129,250 | $35,000 | $94,250 |
| 2016 | $0 | $129,250 | $35,000 | $94,250 |
| 2015 | -- | $99,125 | $21,250 | $77,875 |
| 2014 | -- | $99,125 | $21,250 | $77,875 |
Source: Public Records
Map
Nearby Homes
- 2772 Cabin Run Bridge Rd
- 3623 Martins Mill Rd
- 2709 Sporting Hill Bridge Rd
- 3226 Pleasantville Bridge Rd
- 2720 Pool Forge Bridge Rd
- 3178 Pleasantville Bridge Rd
- 2935 Avenue Downs Dr
- 2915 Avenue Downs Dr
- 2757 Otterham Dr
- 4013 Kathie Dr
- 2725 Otterham Dr
- 2736 Critz Ln
- 3549 Creamery Bridge Rd
- 3313 Sarah Bee Ln
- 3400 Sarah Bee Ln
- 3376 Sarah Bee Ln
- 3384 Sarah Bee Ln
- 3133 Setting Sun Dr
- 2733 Bramblewood Ln
- 3206 Arundel Ln