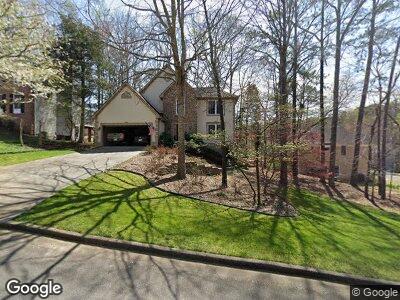
3535 Waters Cove Way Alpharetta, GA 30022
Estimated Value: $573,000 - $653,000
4
Beds
3
Baths
2,217
Sq Ft
$277/Sq Ft
Est. Value
About This Home
This home is located at 3535 Waters Cove Way, Alpharetta, GA 30022 and is currently estimated at $615,133, approximately $277 per square foot. 3535 Waters Cove Way is a home located in Fulton County with nearby schools including Dolvin Elementary School, Autrey Mill Middle School, and Johns Creek High School.
Ownership History
Date
Name
Owned For
Owner Type
Purchase Details
Closed on
May 25, 2007
Sold by
Loftis Stephen R
Bought by
Maxwell James W and Maxwell Carol B
Current Estimated Value
Home Financials for this Owner
Home Financials are based on the most recent Mortgage that was taken out on this home.
Original Mortgage
$140,000
Outstanding Balance
$87,383
Interest Rate
6.12%
Mortgage Type
New Conventional
Estimated Equity
$527,750
Purchase Details
Closed on
Dec 8, 2006
Sold by
Wilson Wade and Wilson Andrea
Bought by
Loftis Stephen R
Purchase Details
Closed on
Aug 14, 2006
Sold by
Loftis Stephen R
Bought by
Wilson Wade and Wilson Andrea
Purchase Details
Closed on
Jul 25, 2000
Sold by
Hawa Victor B and Hawa Ruth K
Bought by
Loftis Stephen R and Loftis Mandy
Home Financials for this Owner
Home Financials are based on the most recent Mortgage that was taken out on this home.
Original Mortgage
$192,000
Interest Rate
8.23%
Mortgage Type
New Conventional
Create a Home Valuation Report for This Property
The Home Valuation Report is an in-depth analysis detailing your home's value as well as a comparison with similar homes in the area
Home Values in the Area
Average Home Value in this Area
Purchase History
| Date | Buyer | Sale Price | Title Company |
|---|---|---|---|
| Maxwell James W | $308,000 | -- | |
| Loftis Stephen R | $150,000 | -- | |
| Wilson Wade | $150,000 | -- | |
| Loftis Stephen R | -- | -- | |
| Loftis Stephen R | $222,000 | -- |
Source: Public Records
Mortgage History
| Date | Status | Borrower | Loan Amount |
|---|---|---|---|
| Open | Maxwell James W | $140,000 | |
| Previous Owner | Loftis Stephen R | $192,000 | |
| Previous Owner | Hawa Victor | $133,000 |
Source: Public Records
Tax History Compared to Growth
Tax History
| Year | Tax Paid | Tax Assessment Tax Assessment Total Assessment is a certain percentage of the fair market value that is determined by local assessors to be the total taxable value of land and additions on the property. | Land | Improvement |
|---|---|---|---|---|
| 2023 | $6,107 | $216,360 | $52,840 | $163,520 |
| 2022 | $2,562 | $141,040 | $34,800 | $106,240 |
| 2021 | $2,960 | $136,920 | $33,800 | $103,120 |
| 2020 | $2,968 | $129,760 | $37,280 | $92,480 |
| 2019 | $418 | $127,440 | $36,600 | $90,840 |
| 2018 | $2,923 | $124,440 | $35,760 | $88,680 |
| 2017 | $2,511 | $98,000 | $28,960 | $69,040 |
| 2016 | $2,498 | $98,000 | $28,960 | $69,040 |
| 2015 | $2,870 | $98,000 | $28,960 | $69,040 |
| 2014 | $2,089 | $80,880 | $15,120 | $65,760 |
Source: Public Records
Map
Nearby Homes
- 2590 Runic Way
- 10440 Cranchester Way Unit 2
- 10460 Cranchester Way
- 10420 Summer Creek Dr
- 850 Highland Bend Cove
- 120 Thome Dr
- 3585 Legacy Trace
- 10350 Alvin Rd
- 645 Crossbridge Alley
- 3465 Jones Ferry Ln
- 300 Olmstead Way
- 1050 Westwell Run
- 10245 Old Woodland Entry
- 10090 Jones Bridge Rd Unit 2
- 10015 Timberstone Rd
- 3150 Berkshire Manor Dr
- 9030 Brockham Way Unit 1
- 335 Wyehwood Ct