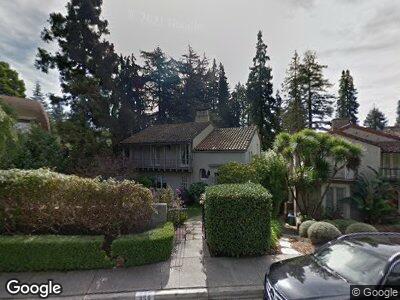
356 Mountain Ave Piedmont, CA 94611
Central Piedmont NeighborhoodEstimated Value: $2,666,000 - $3,167,000
4
Beds
4
Baths
3,293
Sq Ft
$870/Sq Ft
Est. Value
About This Home
This home is located at 356 Mountain Ave, Piedmont, CA 94611 and is currently estimated at $2,863,624, approximately $869 per square foot. 356 Mountain Ave is a home located in Alameda County with nearby schools including Piedmont Middle School, Piedmont High School, and St. Theresa Catholic Elementary School.
Ownership History
Date
Name
Owned For
Owner Type
Purchase Details
Closed on
Oct 28, 2004
Sold by
Wells Aaron G and Chung Marilda H
Bought by
Chung Marilda H
Current Estimated Value
Home Financials for this Owner
Home Financials are based on the most recent Mortgage that was taken out on this home.
Original Mortgage
$250,000
Outstanding Balance
$1,754
Interest Rate
5.8%
Mortgage Type
Credit Line Revolving
Estimated Equity
$2,738,622
Purchase Details
Closed on
Mar 15, 1999
Sold by
Baum Ronnie S and Baum Teresa K
Bought by
Wells Aaron G and Chung Marilda H
Home Financials for this Owner
Home Financials are based on the most recent Mortgage that was taken out on this home.
Original Mortgage
$1,000,000
Interest Rate
7.12%
Purchase Details
Closed on
Sep 9, 1994
Sold by
Burke Patricia Ann
Bought by
Baum Ronnie S and Baum Teresa K
Home Financials for this Owner
Home Financials are based on the most recent Mortgage that was taken out on this home.
Original Mortgage
$694,000
Interest Rate
4.6%
Create a Home Valuation Report for This Property
The Home Valuation Report is an in-depth analysis detailing your home's value as well as a comparison with similar homes in the area
Home Values in the Area
Average Home Value in this Area
Purchase History
| Date | Buyer | Sale Price | Title Company |
|---|---|---|---|
| Chung Marilda H | -- | -- | |
| Wells Aaron G | $1,275,000 | Old Republic Title Company | |
| Baum Ronnie S | $867,500 | Northwestern Title Company |
Source: Public Records
Mortgage History
| Date | Status | Borrower | Loan Amount |
|---|---|---|---|
| Closed | Chung Marilda H | $250,000 | |
| Open | Wells Aaron G | $964,500 | |
| Closed | Wells Aaron G | $970,000 | |
| Closed | Wells Aaron G | $1,000,000 | |
| Previous Owner | Baum Ronnie S | $694,000 |
Source: Public Records
Tax History Compared to Growth
Tax History
| Year | Tax Paid | Tax Assessment Tax Assessment Total Assessment is a certain percentage of the fair market value that is determined by local assessors to be the total taxable value of land and additions on the property. | Land | Improvement |
|---|---|---|---|---|
| 2024 | $29,159 | $1,959,534 | $587,860 | $1,371,674 |
| 2023 | $28,722 | $1,921,118 | $576,335 | $1,344,783 |
| 2022 | $27,920 | $1,883,454 | $565,036 | $1,318,418 |
| 2021 | $26,647 | $1,846,531 | $553,959 | $1,292,572 |
| 2020 | $26,582 | $1,827,597 | $548,279 | $1,279,318 |
| 2019 | $26,352 | $1,791,770 | $537,531 | $1,254,239 |
| 2018 | $25,446 | $1,756,643 | $526,993 | $1,229,650 |
| 2017 | $25,510 | $1,722,205 | $516,661 | $1,205,544 |
| 2016 | $23,657 | $1,688,443 | $506,533 | $1,181,910 |
| 2015 | $23,713 | $1,663,084 | $498,925 | $1,164,159 |
| 2014 | $23,448 | $1,630,507 | $489,152 | $1,141,355 |
Source: Public Records
Map
Nearby Homes
- 336 Mountain Ave
- 65 Sea View Ave
- 26 Sea View Ave
- 126 Caperton Ave
- 52 Glen Alpine Rd
- 139 Hagar Ave
- 701 Blair Ave
- 5501 La Salle Ave
- 224 Pala Ave
- 5980 Harbord Dr
- 295 Scenic Ave
- 30 Prospect Rd
- 24 Somerset Rd
- 5932 Harbord Dr
- 3 Abbott Way
- 1160 Clarendon Crescent
- 1046 Ashmount Ave
- 22 Valant Place
- 1109 Mandana Blvd
- 1048 Clarendon Crescent