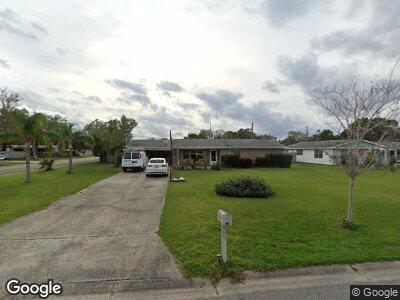
356 Wilmette Cir Ormond Beach, FL 32174
Ormond Terrace NeighborhoodEstimated Value: $264,245 - $380,000
3
Beds
2
Baths
1,452
Sq Ft
$223/Sq Ft
Est. Value
About This Home
This home is located at 356 Wilmette Cir, Ormond Beach, FL 32174 and is currently estimated at $324,061, approximately $223 per square foot. 356 Wilmette Cir is a home located in Volusia County with nearby schools including Ormond Beach Elementary School, Ormond Beach Middle School, and Seabreeze High School.
Ownership History
Date
Name
Owned For
Owner Type
Purchase Details
Closed on
Jun 11, 2014
Sold by
Gallagher Keith D
Bought by
Osprey Foundation Llc and Marcy Land Trust
Current Estimated Value
Purchase Details
Closed on
Aug 27, 2012
Sold by
Osprey Foundation Llc
Bought by
Gallagher Keith D and Gallagher Bridget K
Purchase Details
Closed on
May 15, 2004
Sold by
Gallagher Keith
Bought by
Osprey Foundation Llc and Marcy Land Trust
Purchase Details
Closed on
Mar 15, 1992
Bought by
Osprey Foundation Llc Tr
Purchase Details
Closed on
Nov 15, 1989
Bought by
Osprey Foundation Llc Tr
Purchase Details
Closed on
Sep 15, 1989
Bought by
Osprey Foundation Llc Tr
Purchase Details
Closed on
Jan 15, 1987
Bought by
Osprey Foundation Llc Tr
Purchase Details
Closed on
Mar 15, 1972
Bought by
Osprey Foundation Llc Tr
Create a Home Valuation Report for This Property
The Home Valuation Report is an in-depth analysis detailing your home's value as well as a comparison with similar homes in the area
Home Values in the Area
Average Home Value in this Area
Purchase History
| Date | Buyer | Sale Price | Title Company |
|---|---|---|---|
| Osprey Foundation Llc | -- | Attorney | |
| Gallagher Keith D | $135,700 | Attorney | |
| Osprey Foundation Llc | $25,000 | -- | |
| Osprey Foundation Llc Tr | $74,200 | -- | |
| Osprey Foundation Llc Tr | $100 | -- | |
| Osprey Foundation Llc Tr | $100 | -- | |
| Osprey Foundation Llc Tr | $67,000 | -- | |
| Osprey Foundation Llc Tr | $24,900 | -- |
Source: Public Records
Mortgage History
| Date | Status | Borrower | Loan Amount |
|---|---|---|---|
| Previous Owner | Osprey Foundation Llc | $148,800 |
Source: Public Records
Tax History Compared to Growth
Tax History
| Year | Tax Paid | Tax Assessment Tax Assessment Total Assessment is a certain percentage of the fair market value that is determined by local assessors to be the total taxable value of land and additions on the property. | Land | Improvement |
|---|---|---|---|---|
| 2025 | $3,557 | $245,690 | $57,200 | $188,490 |
| 2024 | $3,557 | $246,913 | $57,200 | $189,713 |
| 2023 | $3,557 | $243,555 | $51,920 | $191,635 |
| 2022 | $3,202 | $213,154 | $51,920 | $161,234 |
| 2021 | $3,023 | $176,360 | $47,080 | $129,280 |
| 2020 | $2,754 | $161,034 | $47,080 | $113,954 |
| 2019 | $2,576 | $154,722 | $47,615 | $107,107 |
| 2018 | $2,393 | $138,485 | $40,050 | $98,435 |
| 2017 | $2,298 | $129,528 | $39,900 | $89,628 |
| 2016 | $2,146 | $114,402 | $0 | $0 |
| 2015 | $2,038 | $105,056 | $0 | $0 |
| 2014 | $1,796 | $86,992 | $0 | $0 |
Source: Public Records
Map
Nearby Homes
- 199 Rosewood Ave
- 290 Warwick Ave
- 83 Kenilworth Ave
- 303 Warwick Ave
- 89 Rosewood Ave
- 509 Mcintosh Rd
- 530 Mcintosh Rd
- 130 Hernandez Ave
- 219 N Ridgewood Ave
- 475 West St
- 28 Wilmette Ave
- 170 N Yonge St Unit 92
- 170 N Yonge St Unit 48
- 170 N Yonge St Unit 27
- 170 N Yonge St Unit 21
- 85 Warwick Ave
- 145 N Yonge St
- 63 Hernandez Ave
- 48 Rosewood Ave
- 595 Andrews St