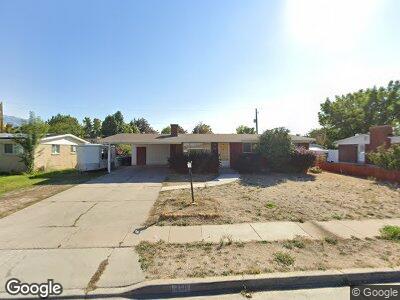
358 E 6220 S Salt Lake City, UT 84107
Estimated Value: $538,000 - $628,695
4
Beds
3
Baths
2,368
Sq Ft
$247/Sq Ft
Est. Value
About This Home
This home is located at 358 E 6220 S, Salt Lake City, UT 84107 and is currently estimated at $583,924, approximately $246 per square foot. 358 E 6220 S is a home located in Salt Lake County with nearby schools including Longview Elementary School, Hillcrest Junior High School, and Murray High School.
Ownership History
Date
Name
Owned For
Owner Type
Purchase Details
Closed on
Apr 5, 2023
Sold by
Storheim Matthew K
Bought by
Nielsen Patricia M and Call Natalie L
Current Estimated Value
Home Financials for this Owner
Home Financials are based on the most recent Mortgage that was taken out on this home.
Original Mortgage
$413,000
Outstanding Balance
$404,302
Interest Rate
6.5%
Mortgage Type
New Conventional
Estimated Equity
$179,622
Purchase Details
Closed on
Oct 17, 2022
Sold by
Li Keyong
Bought by
Storheim Matthew K
Home Financials for this Owner
Home Financials are based on the most recent Mortgage that was taken out on this home.
Original Mortgage
$425,000
Interest Rate
6.02%
Mortgage Type
New Conventional
Purchase Details
Closed on
Sep 23, 2016
Sold by
Noble Norman R and Noble Nora L
Bought by
Li Keyong
Purchase Details
Closed on
Dec 18, 2014
Sold by
Grove Iris A
Bought by
Grove Iris A and The Iris A Grove Family Living Trust
Create a Home Valuation Report for This Property
The Home Valuation Report is an in-depth analysis detailing your home's value as well as a comparison with similar homes in the area
Home Values in the Area
Average Home Value in this Area
Purchase History
| Date | Buyer | Sale Price | Title Company |
|---|---|---|---|
| Nielsen Patricia M | -- | Title Guarantee | |
| Storheim Matthew K | -- | Real Advantage Title Insurance | |
| Li Keyong | -- | Integrated Title Ins Service | |
| Grove Iris A | -- | None Available |
Source: Public Records
Mortgage History
| Date | Status | Borrower | Loan Amount |
|---|---|---|---|
| Open | Nielsen Patricia M | $413,000 | |
| Previous Owner | Storheim Matthew K | $425,000 |
Source: Public Records
Tax History Compared to Growth
Tax History
| Year | Tax Paid | Tax Assessment Tax Assessment Total Assessment is a certain percentage of the fair market value that is determined by local assessors to be the total taxable value of land and additions on the property. | Land | Improvement |
|---|---|---|---|---|
| 2023 | $1,983 | $421,300 | $200,300 | $221,000 |
| 2022 | $2,157 | $435,700 | $196,400 | $239,300 |
| 2021 | $1,827 | $325,500 | $151,000 | $174,500 |
| 2020 | $1,723 | $290,500 | $143,500 | $147,000 |
| 2019 | $1,891 | $281,400 | $143,500 | $137,900 |
| 2018 | $1,622 | $269,500 | $96,000 | $173,500 |
| 2017 | $1,564 | $262,000 | $96,000 | $166,000 |
| 2016 | $1,280 | $212,000 | $96,000 | $116,000 |
| 2015 | $1,280 | $188,000 | $122,400 | $65,600 |
| 2014 | -- | $176,500 | $120,000 | $56,500 |
Source: Public Records
Map
Nearby Homes
- 344 Wilford Ave
- 421 E 6220 S
- 6259 S 340 E
- 6292 S 300 E
- 331 E Winchester St
- 347 E Winchester St
- 337 E Winchester St
- 5862 Ayrshire Dr
- 5845 Kerry Cir
- 581 E Fashion Creek Ct
- 6309 S 725 E
- 647 Shiloh Way
- 630 E Evesham Dr
- 470 E Bridlewalk Ln
- 333 E Perrine Dr
- 341 Perrine Dr Unit 345
- 6755 S 300 E
- 5775 S Fashion Blvd
- 8 W 6000 S
- 6337 S Glen Oaks St