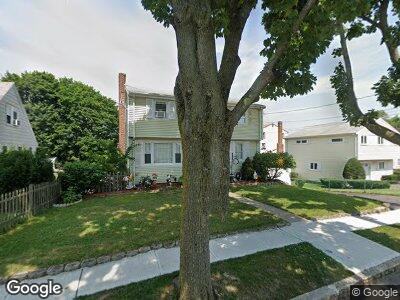
36 Shed St Quincy, MA 02169
Germantown NeighborhoodEstimated Value: $617,770 - $693,000
4
Beds
2
Baths
1,470
Sq Ft
$453/Sq Ft
Est. Value
About This Home
This home is located at 36 Shed St, Quincy, MA 02169 and is currently estimated at $665,943, approximately $453 per square foot. 36 Shed St is a home located in Norfolk County with nearby schools including Snug Harbor Community School, Broad Meadows Middle School, and Quincy High School.
Ownership History
Date
Name
Owned For
Owner Type
Purchase Details
Closed on
Dec 6, 2010
Sold by
Fnma
Bought by
Gillis Kimberly M
Current Estimated Value
Home Financials for this Owner
Home Financials are based on the most recent Mortgage that was taken out on this home.
Original Mortgage
$276,279
Interest Rate
4.22%
Mortgage Type
Purchase Money Mortgage
Purchase Details
Closed on
Aug 3, 2010
Sold by
Nasrallh Joseph
Bought by
Federal National Mortgage Association
Purchase Details
Closed on
Feb 22, 2007
Sold by
Mortgage Guaranty Corp
Bought by
Nasrallh Joseph
Home Financials for this Owner
Home Financials are based on the most recent Mortgage that was taken out on this home.
Original Mortgage
$260,000
Interest Rate
6.23%
Mortgage Type
Purchase Money Mortgage
Purchase Details
Closed on
Jul 26, 2006
Sold by
Sum Christine and Okeefe Doris
Bought by
Hsbc Bank Usa Na
Purchase Details
Closed on
Dec 17, 2003
Sold by
Whitlow Elizabeth M
Bought by
Sum Christine and Okeefe Doris
Home Financials for this Owner
Home Financials are based on the most recent Mortgage that was taken out on this home.
Original Mortgage
$304,000
Interest Rate
5.96%
Mortgage Type
Purchase Money Mortgage
Create a Home Valuation Report for This Property
The Home Valuation Report is an in-depth analysis detailing your home's value as well as a comparison with similar homes in the area
Home Values in the Area
Average Home Value in this Area
Purchase History
| Date | Buyer | Sale Price | Title Company |
|---|---|---|---|
| Gillis Kimberly M | $280,000 | -- | |
| Federal National Mortgage Association | $290,488 | -- | |
| Nasrallh Joseph | $325,000 | -- | |
| Hsbc Bank Usa Na | $324,165 | -- | |
| Sum Christine | $320,000 | -- |
Source: Public Records
Mortgage History
| Date | Status | Borrower | Loan Amount |
|---|---|---|---|
| Open | Gillis Kimberly M | $295,000 | |
| Closed | Gillis Kimberly M | $276,279 | |
| Previous Owner | Nasrallh Joseph | $260,000 | |
| Previous Owner | Sum Christine | $304,000 |
Source: Public Records
Tax History Compared to Growth
Tax History
| Year | Tax Paid | Tax Assessment Tax Assessment Total Assessment is a certain percentage of the fair market value that is determined by local assessors to be the total taxable value of land and additions on the property. | Land | Improvement |
|---|---|---|---|---|
| 2025 | $6,715 | $582,400 | $246,800 | $335,600 |
| 2024 | $6,495 | $576,300 | $246,800 | $329,500 |
| 2023 | $5,912 | $531,200 | $224,300 | $306,900 |
| 2022 | $5,464 | $456,100 | $172,600 | $283,500 |
| 2021 | $5,083 | $418,700 | $150,100 | $268,600 |
| 2020 | $5,192 | $417,700 | $166,800 | $250,900 |
| 2019 | $4,923 | $392,300 | $153,000 | $239,300 |
| 2018 | $4,901 | $367,400 | $145,800 | $221,600 |
| 2017 | $4,729 | $333,700 | $132,500 | $201,200 |
| 2016 | $4,826 | $336,100 | $147,200 | $188,900 |
| 2015 | $4,488 | $307,400 | $133,800 | $173,600 |
| 2014 | $4,180 | $281,300 | $121,700 | $159,600 |
Source: Public Records
Map
Nearby Homes
- 10 Forbush Ave
- 170 Palmer St
- 15 Edwards Ln
- 55 Riverbank Rd
- 52 Beebe Rd
- 38-40 Lawn Ave
- 599 Sea St Unit A
- 18 Lawn Ave
- 107 Spring St
- 568 Sea St
- 107 Baxter Ave
- 200 Cove Way Unit 105
- 200 Cove Way Unit 1015
- 295 Rock Island Rd
- 91 Curtis Ave
- 255 State St
- 19 Hawthorne St
- 30 Elcott Rd
- 33 Curtis Ave
- 100 Cove Way Unit 601