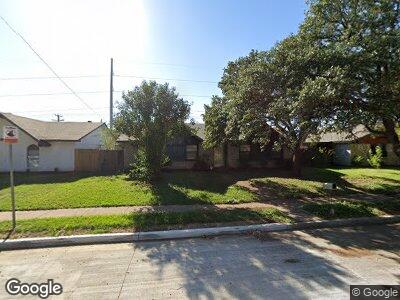
3605 S Elm Dr Grand Prairie, TX 75052
Park Valley NeighborhoodEstimated Value: $271,000 - $321,000
3
Beds
2
Baths
1,557
Sq Ft
$187/Sq Ft
Est. Value
About This Home
This home is located at 3605 S Elm Dr, Grand Prairie, TX 75052 and is currently estimated at $291,041, approximately $186 per square foot. 3605 S Elm Dr is a home located in Dallas County with nearby schools including Crosswinds High School, Ervin C. Whitt Elementary School, and Andrew Jackson Middle.
Ownership History
Date
Name
Owned For
Owner Type
Purchase Details
Closed on
Dec 7, 2020
Sold by
Cook Coni T
Bought by
Romo Janie
Current Estimated Value
Home Financials for this Owner
Home Financials are based on the most recent Mortgage that was taken out on this home.
Original Mortgage
$153,000
Outstanding Balance
$137,999
Interest Rate
2.8%
Mortgage Type
Seller Take Back
Estimated Equity
$153,042
Purchase Details
Closed on
Jul 7, 2017
Sold by
Cook Coni T
Bought by
Cook Coni T
Purchase Details
Closed on
Dec 22, 2014
Sold by
Montague Christa Leigh
Bought by
Baugh Harbor Llc
Purchase Details
Closed on
Jan 10, 2014
Sold by
Domangue James Phillip and Domangue Linda Long
Bought by
Cook Coni T
Home Financials for this Owner
Home Financials are based on the most recent Mortgage that was taken out on this home.
Original Mortgage
$66,000
Interest Rate
4.34%
Mortgage Type
Purchase Money Mortgage
Create a Home Valuation Report for This Property
The Home Valuation Report is an in-depth analysis detailing your home's value as well as a comparison with similar homes in the area
Home Values in the Area
Average Home Value in this Area
Purchase History
| Date | Buyer | Sale Price | Title Company |
|---|---|---|---|
| Romo Janie | -- | None Listed On Document | |
| Romo Janie | -- | None Listed On Document | |
| Cook Coni T | -- | None Available | |
| Baugh Harbor Llc | -- | None Available | |
| Cook Coni T | -- | Allegiance |
Source: Public Records
Mortgage History
| Date | Status | Borrower | Loan Amount |
|---|---|---|---|
| Open | Romo Janie | $153,000 | |
| Closed | Romo Janie | $153,000 | |
| Previous Owner | Cook Coni T | $66,000 |
Source: Public Records
Tax History Compared to Growth
Tax History
| Year | Tax Paid | Tax Assessment Tax Assessment Total Assessment is a certain percentage of the fair market value that is determined by local assessors to be the total taxable value of land and additions on the property. | Land | Improvement |
|---|---|---|---|---|
| 2023 | $3,740 | $215,000 | $40,000 | $175,000 |
| 2022 | $4,183 | $233,780 | $0 | $0 |
| 2021 | $4,842 | $182,180 | $40,000 | $142,180 |
| 2020 | $4,602 | $163,220 | $25,000 | $138,220 |
| 2019 | $4,768 | $163,220 | $25,000 | $138,220 |
| 2018 | $4,768 | $163,220 | $25,000 | $138,220 |
| 2017 | $3,777 | $129,370 | $25,000 | $104,370 |
| 2016 | $2,964 | $101,530 | $23,000 | $78,530 |
| 2015 | $2,067 | $88,530 | $18,000 | $70,530 |
| 2014 | $2,067 | $88,530 | $18,000 | $70,530 |
Source: Public Records
Map
Nearby Homes
- 3506 S Elm Dr
- 520 Sir Roland Dr
- 3602 Corn Valley Rd
- 718 S Holiday Dr
- 3161 Edelweiss Dr
- 702 Edelweiss Dr
- 45 W Townhouse Ln
- 3733 Magnolia Dr
- 20 W Townhouse Ln
- 29 W Mountain Creek Dr Unit 17
- 302 W Warrior Trail
- 506 Royal Valley Rd
- 305 Gregory Ln
- 20 W Mountain Ln Unit 42
- 402 W Warrior Trail
- 3029 Meadow Creek Ct
- 644 Three Tee Ct
- 647 Three Tee Ct
- 1 E Mountain Ln Unit 33
- 3807 Kentucky Ct