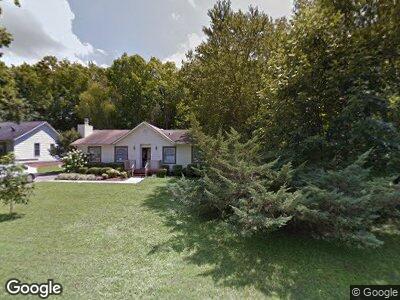
3609 Marquis Dr Durham, NC 27704
Duke Homestead NeighborhoodEstimated Value: $502,000
3
Beds
2
Baths
1,830
Sq Ft
$274/Sq Ft
Est. Value
About This Home
This home is located at 3609 Marquis Dr, Durham, NC 27704 and is currently priced at $502,000, approximately $274 per square foot. 3609 Marquis Dr is a home located in Durham County with nearby schools including Holt Elementary, George L Carrington Middle, and Northern High School.
Ownership History
Date
Name
Owned For
Owner Type
Purchase Details
Closed on
Dec 29, 2020
Sold by
Arklie Korinna E
Bought by
Decicco Craig and Yankes Lauren
Current Estimated Value
Home Financials for this Owner
Home Financials are based on the most recent Mortgage that was taken out on this home.
Original Mortgage
$262,500
Outstanding Balance
$239,026
Interest Rate
2.7%
Mortgage Type
New Conventional
Estimated Equity
$366,474
Purchase Details
Closed on
Jun 4, 2018
Sold by
Shaw Ryan and Shaw Sandy
Bought by
Arklie Korinna E
Home Financials for this Owner
Home Financials are based on the most recent Mortgage that was taken out on this home.
Original Mortgage
$294,950
Interest Rate
4.12%
Mortgage Type
Adjustable Rate Mortgage/ARM
Purchase Details
Closed on
Aug 5, 2015
Sold by
Hodge Joseph Blaine and Hodge Karryn Shaw
Bought by
Shaw Ryan Edwin and Shaw Sandy Kaye
Create a Home Valuation Report for This Property
The Home Valuation Report is an in-depth analysis detailing your home's value as well as a comparison with similar homes in the area
Home Values in the Area
Average Home Value in this Area
Purchase History
| Date | Buyer | Sale Price | Title Company |
|---|---|---|---|
| Decicco Craig | $400,000 | None Available | |
| Arklie Korinna E | $347,000 | None Available | |
| Shaw Ryan Edwin | $165,000 | Attorney |
Source: Public Records
Mortgage History
| Date | Status | Borrower | Loan Amount |
|---|---|---|---|
| Open | Decicco Craig | $262,500 | |
| Previous Owner | Arklie Korinna E | $294,950 | |
| Previous Owner | Shaw Karyn Elizabeth | $20,000 |
Source: Public Records
Tax History Compared to Growth
Tax History
| Year | Tax Paid | Tax Assessment Tax Assessment Total Assessment is a certain percentage of the fair market value that is determined by local assessors to be the total taxable value of land and additions on the property. | Land | Improvement |
|---|---|---|---|---|
| 2023 | $3,834 | $292,731 | $107,380 | $185,351 |
| 2022 | $3,747 | $292,731 | $107,380 | $185,351 |
| 2021 | $3,729 | $292,731 | $107,380 | $185,351 |
| 2020 | $3,641 | $292,731 | $107,380 | $185,351 |
| 2019 | $3,641 | $292,731 | $107,380 | $185,351 |
| 2018 | $2,526 | $186,220 | $58,077 | $128,143 |
| 2017 | $2,507 | $186,220 | $58,077 | $128,143 |
| 2016 | $2,423 | $192,673 | $64,530 | $128,143 |
| 2015 | $2,695 | $194,657 | $40,284 | $154,373 |
| 2014 | $2,695 | $194,657 | $40,284 | $154,373 |
Source: Public Records
Map
Nearby Homes
- 927 Ferncrest Dr
- 1911 Stadium Dr
- 7 Harrigan Ct
- 1011 Wyldewood Rd
- 2408 Stadium Dr Unit A
- 711 Horton Rd
- 13 Patriot Cir
- 26 Stonewall Way
- 3011 Kenan Rd
- 3 Patriot Cir
- 2702 Richwood Rd
- 12 Patriot Cir
- 11 Stone Village Ct
- 2509 Stadium Dr
- 2806 Shaftsbury St
- 14 Stone Village Ct
- 5 Sidbrook Ct
- 212 Pinewood Dr
- 1431 Cherrycrest Dr
- 1903 Kirkwood Dr