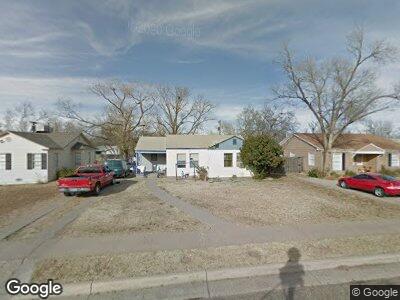
3614 30th St Lubbock, TX 79410
Maxey Park NeighborhoodEstimated Value: $113,000 - $146,378
3
Beds
2
Baths
1,136
Sq Ft
$119/Sq Ft
Est. Value
About This Home
This home is located at 3614 30th St, Lubbock, TX 79410 and is currently estimated at $135,095, approximately $118 per square foot. 3614 30th St is a home located in Lubbock County with nearby schools including Overton Elementary School, Commander William C. McCool Academy, and Coronado High School.
Ownership History
Date
Name
Owned For
Owner Type
Purchase Details
Closed on
Mar 18, 2019
Sold by
Hrhm Invest Llc
Bought by
Arnon Llc
Current Estimated Value
Purchase Details
Closed on
May 19, 2016
Sold by
Secretary Of Hud
Bought by
Hrhm Invest Llc
Home Financials for this Owner
Home Financials are based on the most recent Mortgage that was taken out on this home.
Original Mortgage
$74,545
Interest Rate
3.59%
Mortgage Type
Future Advance Clause Open End Mortgage
Purchase Details
Closed on
Dec 31, 2015
Sold by
Us Bank Na
Bought by
The Secretary Of The Department Of Housi
Purchase Details
Closed on
Dec 9, 2015
Sold by
Holguin George and Holguin Anita M
Bought by
U S Bank Na
Purchase Details
Closed on
May 13, 2013
Sold by
Holguin George
Bought by
Mendez San Juanita
Purchase Details
Closed on
Dec 1, 2012
Sold by
Myers Brian B and Myers Tara
Bought by
Wble Llc
Create a Home Valuation Report for This Property
The Home Valuation Report is an in-depth analysis detailing your home's value as well as a comparison with similar homes in the area
Home Values in the Area
Average Home Value in this Area
Purchase History
| Date | Buyer | Sale Price | Title Company |
|---|---|---|---|
| Arnon Llc | -- | Service Title Company | |
| Hrhm Invest Llc | -- | Title One | |
| The Secretary Of The Department Of Housi | -- | None Available | |
| U S Bank Na | $44,460 | None Available | |
| Mendez San Juanita | -- | None Available | |
| Wble Llc | -- | None Available |
Source: Public Records
Mortgage History
| Date | Status | Borrower | Loan Amount |
|---|---|---|---|
| Previous Owner | Hrhm Invest Llc | $74,545 |
Source: Public Records
Tax History Compared to Growth
Tax History
| Year | Tax Paid | Tax Assessment Tax Assessment Total Assessment is a certain percentage of the fair market value that is determined by local assessors to be the total taxable value of land and additions on the property. | Land | Improvement |
|---|---|---|---|---|
| 2024 | $2,394 | $131,840 | $26,300 | $105,540 |
| 2023 | $2,388 | $128,478 | $10,980 | $117,498 |
| 2022 | $2,127 | $105,082 | $10,980 | $94,102 |
| 2021 | $2,067 | $96,527 | $10,980 | $85,547 |
| 2020 | $1,932 | $88,856 | $10,980 | $77,876 |
| 2019 | $1,892 | $84,276 | $10,980 | $73,296 |
| 2018 | $1,894 | $84,276 | $10,980 | $73,296 |
| 2017 | $1,748 | $77,659 | $10,980 | $66,679 |
| 2016 | $1,610 | $71,551 | $10,980 | $60,571 |
| 2015 | $1,056 | $64,078 | $10,980 | $53,098 |
| 2014 | $1,056 | $63,727 | $5,400 | $58,327 |
Source: Public Records