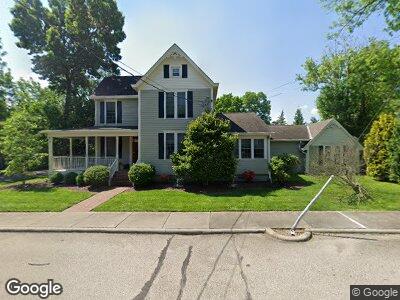
363 Cleveland Ave Glendale, OH 45246
Estimated Value: $353,000 - $487,000
4
Beds
2
Baths
1,856
Sq Ft
$223/Sq Ft
Est. Value
About This Home
This home is located at 363 Cleveland Ave, Glendale, OH 45246 and is currently estimated at $414,170, approximately $223 per square foot. 363 Cleveland Ave is a home located in Hamilton County with nearby schools including Glendale Elementary School, Princeton Community Middle School, and Princeton High School.
Ownership History
Date
Name
Owned For
Owner Type
Purchase Details
Closed on
Jan 13, 2006
Sold by
Geers Douglas Aaron and Geers Tiffany L
Bought by
Anderson Thomas W and Crouse Candace C
Current Estimated Value
Home Financials for this Owner
Home Financials are based on the most recent Mortgage that was taken out on this home.
Original Mortgage
$203,200
Interest Rate
6.37%
Mortgage Type
Fannie Mae Freddie Mac
Purchase Details
Closed on
Jan 4, 2002
Sold by
Geers Henry Joseph and Geers Peggy Ann
Bought by
Geers Douglas Aaron and Geers Tiffany L
Purchase Details
Closed on
Sep 28, 2000
Sold by
Thompson Joseph D
Bought by
Geers Henry Joseph and Geers Peggy Ann
Create a Home Valuation Report for This Property
The Home Valuation Report is an in-depth analysis detailing your home's value as well as a comparison with similar homes in the area
Home Values in the Area
Average Home Value in this Area
Purchase History
| Date | Buyer | Sale Price | Title Company |
|---|---|---|---|
| Anderson Thomas W | $254,000 | The Main Title Agency | |
| Geers Douglas Aaron | $106,900 | -- | |
| Geers Henry Joseph | $83,000 | -- |
Source: Public Records
Mortgage History
| Date | Status | Borrower | Loan Amount |
|---|---|---|---|
| Open | Anderson Thomas W | $169,000 | |
| Closed | Anderson Thomas W | $184,700 | |
| Closed | Anderson Thomas W | $55,300 | |
| Closed | Anderson Thomas W | $192,200 | |
| Closed | Anderson Thomas W | $203,200 | |
| Closed | Anderson Thomas | $50,800 |
Source: Public Records
Tax History Compared to Growth
Tax History
| Year | Tax Paid | Tax Assessment Tax Assessment Total Assessment is a certain percentage of the fair market value that is determined by local assessors to be the total taxable value of land and additions on the property. | Land | Improvement |
|---|---|---|---|---|
| 2024 | $5,407 | $95,039 | $18,473 | $76,566 |
| 2023 | $5,442 | $95,039 | $18,473 | $76,566 |
| 2022 | $5,107 | $72,653 | $18,620 | $54,033 |
| 2021 | $4,791 | $72,653 | $18,620 | $54,033 |
| 2020 | $4,870 | $72,653 | $18,620 | $54,033 |
| 2019 | $4,744 | $65,454 | $16,776 | $48,678 |
| 2018 | $4,525 | $65,454 | $16,776 | $48,678 |
| 2017 | $4,293 | $65,454 | $16,776 | $48,678 |
| 2016 | $4,236 | $64,358 | $16,821 | $47,537 |
| 2015 | $4,281 | $64,358 | $16,821 | $47,537 |
| 2014 | $4,290 | $64,358 | $16,821 | $47,537 |
| 2013 | $4,507 | $68,468 | $17,896 | $50,572 |
Source: Public Records
Map
Nearby Homes
- 304 Cleveland Ave
- 8 Hetherington Ct
- 10949 Chester Rd
- 100 Carruthers Pond Dr
- 10964 Chester Rd
- 505 Glendale Milford Rd
- 11076 Woodward Ln
- 200 W Sharon Rd
- 10135 Wayne Ave
- 141 Harter Ave
- 191 Joliet Ave
- 307 Carriage Circle Dr
- 776 Jackson St
- 3 W Leslie Ave
- 2 W Leslie Ave
- 1 W Leslie Ave
- 0 W Leslie Ave
- 451 Ballyclare Terrace
- 40 Evergreen Cir
- 1757 Woodbine Ave