
Seller's Agent in 2024
Kathleen Mcdonough
Christie's Int'l RE Group
(732) 664-4999
38 Total Sales
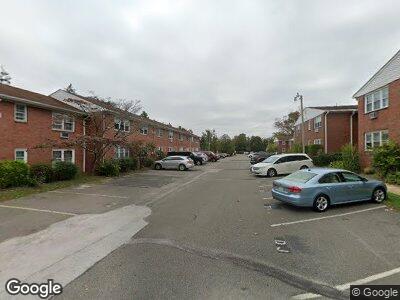
MOVE IN READY BRIGHT AND SUNNY 1 BEDROOM 1 BATH ANNUAL APARTMENT RENTAL IN LONG BRANCH! Apartment is unfurnished and a lower level unit in Westwood Village. It's located minutes from NJ Transit, Monmouth Medical, Monmouth University, Garden State Parkway and the beach! Unit includes updated kitchen with stainless steel appliances, new bathroom vanity, hardwood floors, blinds on every window, plenty of closets throughout and 1 assigned parking spot. Unit also includes a storage space in the basement of the building that is approximately 5 ft x 6.5 ft.
| Date | Buyer | Sale Price | Title Company |
|---|---|---|---|
| Given Not | -- | None Listed On Document | |
| Given Not | -- | None Listed On Document | |
| Given Not | -- | None Listed On Document | |
| Stevenson Austin J | $154,000 | All Ahead Title Agency | |
| Mejia Ismael | $90,000 | Agent For Old Republic Natl | |
| Nogueira Hilario | $50,000 | -- | |
| Kallus Darcy | $39,900 | -- |
| Date | Status | Borrower | Loan Amount |
|---|---|---|---|
| Previous Owner | Stevenson Austin J | $123,200 | |
| Previous Owner | Mejia Ismael | $72,000 | |
| Previous Owner | Nogueira Hilario | $40,000 | |
| Previous Owner | Kallus Darcy | $31,900 |
| Date | Event | Price | Change | Sq Ft Price |
|---|---|---|---|---|
| 10/18/2024 10/18/24 | Rented | $25,800 | +1072.7% | -- |
| 09/12/2024 09/12/24 | For Rent | $2,200 | -91.3% | -- |
| 08/09/2023 08/09/23 | Rented | $25,200 | +1100.0% | -- |
| 07/28/2023 07/28/23 | Under Contract | -- | -- | -- |
| 07/18/2023 07/18/23 | For Rent | $2,100 | -91.5% | -- |
| 06/02/2022 06/02/22 | Rented | $24,700 | +1200.0% | -- |
| 05/28/2022 05/28/22 | Under Contract | -- | -- | -- |
| 05/15/2022 05/15/22 | For Rent | $1,900 | -91.2% | -- |
| 04/19/2021 04/19/21 | Rented | $21,600 | +1100.0% | -- |
| 04/15/2021 04/15/21 | Under Contract | -- | -- | -- |
| 04/01/2021 04/01/21 | For Rent | $1,800 | -91.6% | -- |
| 07/28/2020 07/28/20 | Rented | $21,360 | +1120.6% | -- |
| 07/16/2020 07/16/20 | Under Contract | -- | -- | -- |
| 06/30/2020 06/30/20 | For Rent | $1,750 | 0.0% | -- |
| 02/28/2019 02/28/19 | Sold | $154,900 | +72.1% | $184 / Sq Ft |
| 07/08/2015 07/08/15 | Sold | $90,000 | -- | $107 / Sq Ft |
| Year | Tax Paid | Tax Assessment Tax Assessment Total Assessment is a certain percentage of the fair market value that is determined by local assessors to be the total taxable value of land and additions on the property. | Land | Improvement |
|---|---|---|---|---|
| 2024 | $3,176 | $235,800 | $142,000 | $93,800 |
| 2023 | $3,176 | $204,500 | $115,000 | $89,500 |
| 2022 | $2,803 | $168,800 | $90,000 | $78,800 |
| 2021 | $2,803 | $140,100 | $60,000 | $80,100 |
| 2020 | $2,815 | $134,700 | $55,000 | $79,700 |
| 2019 | $1,995 | $94,900 | $27,000 | $67,900 |
| 2018 | $1,953 | $92,400 | $27,000 | $65,400 |
| 2017 | $1,878 | $91,100 | $27,000 | $64,100 |
| 2016 | $1,809 | $89,500 | $27,000 | $62,500 |
| 2015 | $1,837 | $82,500 | $20,000 | $62,500 |
| 2014 | $1,690 | $80,000 | $55,000 | $25,000 |
Seller's Agent in 2024
Kathleen Mcdonough
Christie's Int'l RE Group
(732) 664-4999
38 Total Sales
m
Seller's Agent in 2019
mary riera
Raritan Bay Realty
3 Total Sales
D
Buyer's Agent in 2019
Donna Kopceuch
Berkshire Hathaway HomeServices Fox & Roach - Manalapan
M
Seller's Agent in 2015
Mario Silvester
Mario's Realty Inc
(732) 616-4231
50 Total Sales