Estimated Value: $783,000 - $879,000
--
Bed
--
Bath
3,660
Sq Ft
$224/Sq Ft
Est. Value
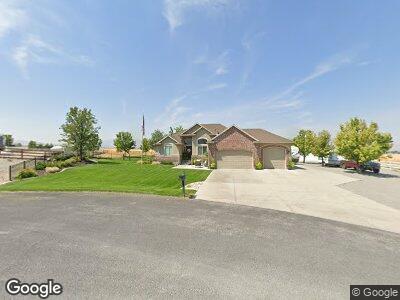
About This Home
This home is located at 3647 Rose Springs Rd, Erda, UT 84074 and is currently estimated at $819,602, approximately $223 per square foot. 3647 Rose Springs Rd is a home located in Tooele County with nearby schools including Overlake Elementary School, Clarke N. Johnsen Junior High School, and Stansbury High School.
Ownership History
Date
Name
Owned For
Owner Type
Purchase Details
Closed on
Jul 29, 2009
Sold by
Fdic
Bought by
Warick Justin and Warick Sharon
Current Estimated Value
Home Financials for this Owner
Home Financials are based on the most recent Mortgage that was taken out on this home.
Original Mortgage
$270,300
Interest Rate
5.31%
Mortgage Type
New Conventional
Purchase Details
Closed on
Apr 9, 2009
Sold by
Bunderson Jason R and Bunderson Michael R
Bought by
America West Bank
Purchase Details
Closed on
Dec 7, 2007
Sold by
Ironwood Real Estate Llc
Bought by
Bunderson Michael R and Bunderson Jason R
Home Financials for this Owner
Home Financials are based on the most recent Mortgage that was taken out on this home.
Original Mortgage
$325,000
Interest Rate
6.3%
Mortgage Type
Construction
Create a Home Valuation Report for This Property
The Home Valuation Report is an in-depth analysis detailing your home's value as well as a comparison with similar homes in the area
Home Values in the Area
Average Home Value in this Area
Purchase History
| Date | Buyer | Sale Price | Title Company |
|---|---|---|---|
| Warick Justin | -- | Cottonwood Title Insurance | |
| America West Bank | -- | Founders Title Company | |
| Bunderson Michael R | -- | B & D Title Co Of Tooele |
Source: Public Records
Mortgage History
| Date | Status | Borrower | Loan Amount |
|---|---|---|---|
| Open | Warick Justin | $352,000 | |
| Closed | Warcik Justin | $155,000 | |
| Closed | Warick Justin | $60,000 | |
| Closed | Warick Justin | $289,000 | |
| Closed | Warick Justin | $25,000 | |
| Closed | Warick Justin | $274,778 | |
| Closed | Warick Justin | $270,300 | |
| Previous Owner | Bunderson Michael R | $325,000 |
Source: Public Records
Tax History Compared to Growth
Tax History
| Year | Tax Paid | Tax Assessment Tax Assessment Total Assessment is a certain percentage of the fair market value that is determined by local assessors to be the total taxable value of land and additions on the property. | Land | Improvement |
|---|---|---|---|---|
| 2024 | $5,943 | $473,364 | $136,200 | $337,164 |
| 2023 | $5,943 | $433,159 | $131,300 | $301,859 |
| 2022 | $4,808 | $436,188 | $137,600 | $298,588 |
| 2021 | $4,372 | $332,856 | $78,250 | $254,606 |
| 2020 | $3,239 | $430,684 | $88,200 | $342,484 |
| 2019 | $3,001 | $393,989 | $88,200 | $305,789 |
| 2018 | $2,945 | $366,190 | $88,200 | $277,990 |
| 2017 | $2,475 | $329,930 | $88,200 | $241,730 |
| 2016 | $2,091 | $176,570 | $49,950 | $126,620 |
| 2015 | $2,091 | $156,027 | $0 | $0 |
| 2014 | -- | $156,027 | $0 | $0 |
Source: Public Records
Map
Nearby Homes
- 3923 Spiral Springs Rd
- 4104 Rose Springs Rd Unit 406
- 4206 Rose Springs Rd
- 4345 Rose Springs Rd
- 4389 N Diamond Ln
- 379 W Church Rd
- 105 W Hummingbird Ln
- 2196 N 425 W Unit 236
- 2086 N 425 W Unit 241
- 2520 N 400 E
- 2540 N 400 E
- 453 W 2030 N Unit 29
- 569 W 2030 N
- 307 E Prestwick Ln Unit 606
- 528 W 1910 N
- 5257 Roma Ln
- 506 W 1910 N Unit 310
- 452 W 1910 N Unit 314
- 4975 N Cambridge Way
- 263 Somerest Ln