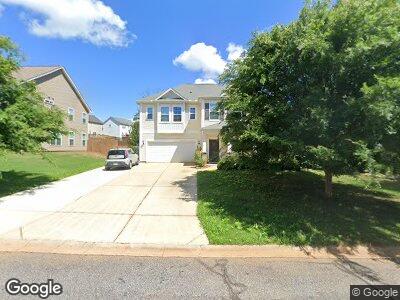
366 Marble Ln Boiling Springs, SC 29316
Estimated Value: $349,000 - $360,000
4
Beds
3
Baths
3,325
Sq Ft
$106/Sq Ft
Est. Value
About This Home
This home is located at 366 Marble Ln, Boiling Springs, SC 29316 and is currently estimated at $353,917, approximately $106 per square foot. 366 Marble Ln is a home located in Spartanburg County with nearby schools including Boiling Springs Middle School and Boiling Springs High School.
Ownership History
Date
Name
Owned For
Owner Type
Purchase Details
Closed on
Jul 21, 2017
Sold by
Mungo Homes Inc
Bought by
Diaz Nathan Adam and Diaz Tara
Current Estimated Value
Home Financials for this Owner
Home Financials are based on the most recent Mortgage that was taken out on this home.
Original Mortgage
$206,503
Interest Rate
4.4%
Mortgage Type
FHA
Purchase Details
Closed on
Jul 6, 2017
Sold by
Mark Iii Properties Inc
Bought by
Mungo Homes Inc
Home Financials for this Owner
Home Financials are based on the most recent Mortgage that was taken out on this home.
Original Mortgage
$206,503
Interest Rate
4.4%
Mortgage Type
FHA
Purchase Details
Closed on
May 23, 2016
Sold by
Mungon Homes Inc
Bought by
Haynesworth Mark and Haynesworth Tracy D
Purchase Details
Closed on
May 26, 2015
Sold by
Mark Iii Properties Inc
Bought by
Mungo Homes Inc
Purchase Details
Closed on
May 8, 2012
Sold by
Lazarus Shouse Communities Llc
Bought by
Mark Iii Properties Inc
Create a Home Valuation Report for This Property
The Home Valuation Report is an in-depth analysis detailing your home's value as well as a comparison with similar homes in the area
Home Values in the Area
Average Home Value in this Area
Purchase History
| Date | Buyer | Sale Price | Title Company |
|---|---|---|---|
| Diaz Nathan Adam | $210,383 | None Available | |
| Mungo Homes Inc | -- | None Available | |
| Haynesworth Mark | $178,775 | None Available | |
| Mungo Homes Inc | $120,000 | None Available | |
| Mark Iii Properties Inc | $1,616,588 | -- |
Source: Public Records
Mortgage History
| Date | Status | Borrower | Loan Amount |
|---|---|---|---|
| Open | Diaz Nathan Adam | $194,500 | |
| Closed | Diaz Nathan Adam | $206,503 | |
| Previous Owner | Mark Iii Properties Inc | $975,000 |
Source: Public Records
Tax History Compared to Growth
Tax History
| Year | Tax Paid | Tax Assessment Tax Assessment Total Assessment is a certain percentage of the fair market value that is determined by local assessors to be the total taxable value of land and additions on the property. | Land | Improvement |
|---|---|---|---|---|
| 2024 | $1,626 | $9,679 | $1,133 | $8,546 |
| 2023 | $1,626 | $9,679 | $1,133 | $8,546 |
| 2022 | $1,450 | $8,416 | $1,000 | $7,416 |
| 2021 | $1,447 | $8,416 | $1,000 | $7,416 |
| 2020 | $1,428 | $8,416 | $1,000 | $7,416 |
| 2019 | $1,428 | $8,416 | $1,000 | $7,416 |
| 2018 | $4,554 | $12,624 | $1,500 | $11,124 |
| 2017 | $36 | $102 | $102 | $0 |
| 2016 | $36 | $102 | $102 | $0 |
| 2015 | $36 | $102 | $102 | $0 |
| 2014 | $36 | $102 | $102 | $0 |
Source: Public Records
Map
Nearby Homes
- 321 Marble Ln
- 536 Goldstone Ln
- 955 Rip Rap Dr
- 370 Slate Dr
- 124 Slate Dr
- 1135 Wanley Way
- 1731 Wabash Place
- 1961 Crumhorn Ave
- 175 Sandy Dr
- 318 War Emblem Dr
- 1782 Wabash Place
- 1794 Wabash Place
- 1798 Wabash Place
- 115 Hunter Ridge Dr
- 119 Hunter Ridge Dr
- 123 Hunter Ridge Dr
- 127 Hunter Ridge Dr
- 131 Hunter Ridge Dr