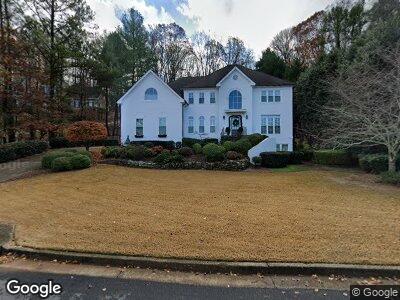
3675 Schooner Ridge Alpharetta, GA 30005
Windward NeighborhoodEstimated Value: $970,000 - $1,069,000
5
Beds
5
Baths
3,906
Sq Ft
$262/Sq Ft
Est. Value
About This Home
This home is located at 3675 Schooner Ridge, Alpharetta, GA 30005 and is currently estimated at $1,023,452, approximately $262 per square foot. 3675 Schooner Ridge is a home located in Fulton County with nearby schools including Lake Windward Elementary School, Webb Bridge Middle School, and Alpharetta High School.
Ownership History
Date
Name
Owned For
Owner Type
Purchase Details
Closed on
Jan 14, 2011
Sold by
Myers Diane A and Myers Robert M
Bought by
Morrison Kevin H and Morrtson Kimberly
Current Estimated Value
Home Financials for this Owner
Home Financials are based on the most recent Mortgage that was taken out on this home.
Original Mortgage
$361,500
Interest Rate
4.82%
Mortgage Type
New Conventional
Purchase Details
Closed on
Jun 15, 2010
Sold by
Unger Vernon E and Unger Kimberly C
Bought by
Morrison Kevin H and Myers Robert
Home Financials for this Owner
Home Financials are based on the most recent Mortgage that was taken out on this home.
Original Mortgage
$353,785
Interest Rate
5.5%
Mortgage Type
FHA
Purchase Details
Closed on
Jun 7, 1996
Sold by
Johnson William A Bobbie
Bought by
Unger Vernon E Kimberly
Create a Home Valuation Report for This Property
The Home Valuation Report is an in-depth analysis detailing your home's value as well as a comparison with similar homes in the area
Home Values in the Area
Average Home Value in this Area
Purchase History
| Date | Buyer | Sale Price | Title Company |
|---|---|---|---|
| Morrison Kevin H | $8,000 | -- | |
| Morrison Kevin H | $473,000 | -- | |
| Unger Vernon E Kimberly | $345,000 | -- |
Source: Public Records
Mortgage History
| Date | Status | Borrower | Loan Amount |
|---|---|---|---|
| Open | Morrison Kevin H | $75,000 | |
| Open | Morrison Kevin H | $408,000 | |
| Closed | Morrison Kevin H | $50,000 | |
| Closed | Morrison Kevin H | $361,500 | |
| Previous Owner | Morrison Kevin H | $353,785 | |
| Previous Owner | Unger Vernon E | $100,000 | |
| Previous Owner | Unger Vernon E | $279,000 | |
| Closed | Unger Vernon E Kimberly | $0 |
Source: Public Records
Tax History Compared to Growth
Tax History
| Year | Tax Paid | Tax Assessment Tax Assessment Total Assessment is a certain percentage of the fair market value that is determined by local assessors to be the total taxable value of land and additions on the property. | Land | Improvement |
|---|---|---|---|---|
| 2023 | $9,277 | $328,680 | $81,040 | $247,640 |
| 2022 | $5,302 | $246,760 | $47,520 | $199,240 |
| 2021 | $6,310 | $239,560 | $46,120 | $193,440 |
| 2020 | $6,336 | $226,280 | $36,480 | $189,800 |
| 2019 | $1,023 | $240,880 | $43,600 | $197,280 |
| 2018 | $5,793 | $235,200 | $42,560 | $192,640 |
| 2017 | $5,249 | $197,360 | $26,920 | $170,440 |
| 2016 | $5,223 | $197,360 | $26,920 | $170,440 |
| 2015 | $6,177 | $197,360 | $26,920 | $170,440 |
| 2014 | $5,080 | $179,640 | $24,520 | $155,120 |
Source: Public Records
Map
Nearby Homes
- 320 Woodlake Ct
- 820 Thermopylae Ct
- 1050 Carnoustie Ln
- 840 Stonehaven Ln
- 2330 Blackheath Trace
- 1100 Muirfield Ct
- 13015 Fox Rd
- 1090 Bay Pointe Crossing
- 5145 Southlake Dr
- 6500 Maid Marion Close
- 2250 Blackheath Trace
- 10 Club Ct
- 1160 Lake Shore Overlook
- 345 Crown Vetch Ln
- 1010 Lake Shore Overlook
- 4440 Webb Bridge Rd
- 320 Dodd Ln
- 1125 Lake Shore Overlook