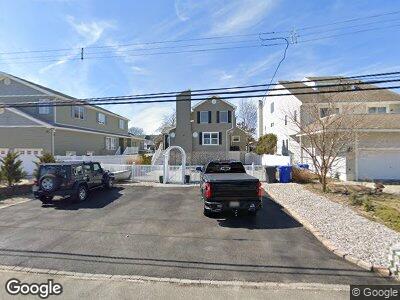
37 Mermaid Rd Toms River, NJ 08753
Estimated Value: $775,000 - $840,000
3
Beds
2
Baths
2,065
Sq Ft
$387/Sq Ft
Est. Value
About This Home
This home is located at 37 Mermaid Rd, Toms River, NJ 08753 and is currently estimated at $798,187, approximately $386 per square foot. 37 Mermaid Rd is a home located in Ocean County.
Ownership History
Date
Name
Owned For
Owner Type
Purchase Details
Closed on
Oct 20, 2009
Sold by
Chiappano Peter P and Chiappano Lynne
Bought by
Chiappano Peter P
Current Estimated Value
Purchase Details
Closed on
Apr 16, 2009
Sold by
Spero Donna
Bought by
Chiappano Peter P and Chiappano Lynn E
Home Financials for this Owner
Home Financials are based on the most recent Mortgage that was taken out on this home.
Original Mortgage
$320,000
Interest Rate
4.93%
Mortgage Type
Purchase Money Mortgage
Purchase Details
Closed on
Apr 15, 2002
Sold by
Cannova John
Bought by
Spero Donna
Home Financials for this Owner
Home Financials are based on the most recent Mortgage that was taken out on this home.
Original Mortgage
$190,000
Interest Rate
6.92%
Purchase Details
Closed on
Sep 14, 1998
Sold by
Cannova Terry and Cannova John
Bought by
Cannova John
Home Financials for this Owner
Home Financials are based on the most recent Mortgage that was taken out on this home.
Original Mortgage
$150,000
Interest Rate
6.89%
Create a Home Valuation Report for This Property
The Home Valuation Report is an in-depth analysis detailing your home's value as well as a comparison with similar homes in the area
Home Values in the Area
Average Home Value in this Area
Purchase History
| Date | Buyer | Sale Price | Title Company |
|---|---|---|---|
| Chiappano Peter P | -- | Lawyers Title Insurance Corp | |
| Chiappano Peter P | $435,000 | Lawyers Title Insurance Corp | |
| Spero Donna | $280,000 | -- | |
| Cannova John | -- | -- |
Source: Public Records
Mortgage History
| Date | Status | Borrower | Loan Amount |
|---|---|---|---|
| Open | Chiappano Peter P | $308,001 | |
| Closed | Chiappano Peter P | $320,000 | |
| Previous Owner | Spero Donna | $160,893 | |
| Previous Owner | Spero Donna | $190,000 | |
| Previous Owner | Cannova John | $150,000 |
Source: Public Records
Tax History Compared to Growth
Tax History
| Year | Tax Paid | Tax Assessment Tax Assessment Total Assessment is a certain percentage of the fair market value that is determined by local assessors to be the total taxable value of land and additions on the property. | Land | Improvement |
|---|---|---|---|---|
| 2024 | $8,344 | $496,500 | $255,000 | $241,500 |
| 2023 | $8,037 | $496,500 | $255,000 | $241,500 |
| 2022 | $8,287 | $496,500 | $255,000 | $241,500 |
| 2021 | $7,510 | $309,800 | $158,800 | $151,000 |
| 2020 | $7,726 | $309,800 | $158,800 | $151,000 |
| 2019 | $7,392 | $309,800 | $158,800 | $151,000 |
| 2018 | $7,293 | $309,800 | $158,800 | $151,000 |
| 2017 | $7,231 | $309,800 | $158,800 | $151,000 |
| 2016 | $7,042 | $309,800 | $158,800 | $151,000 |
| 2015 | $6,631 | $303,200 | $158,800 | $144,400 |
| 2014 | $6,313 | $303,200 | $158,800 | $144,400 |
Source: Public Records
Map
Nearby Homes
- 111 Cedar Berry Ln
- 113 Cedar Berry Ln
- 27 Antiqua Ave
- 2 Cove Point Rd
- 3124 Stanley Dr
- 723 Marie St
- 3166 Windsor Ave
- 3172 Peddie St
- 731 Marie St
- 3402 Sandy Place
- 630 Goose Place
- 663 Beachwood Ave
- 703 Golden Dr
- 673 Ellicott Ave Unit 109
- 596 Baron St
- 3298 Long Point Dr
- 3212 Beachview Dr
- 3166 Beachview Dr
- 3410 Bergen Ave
- 3460 Bergen Ave