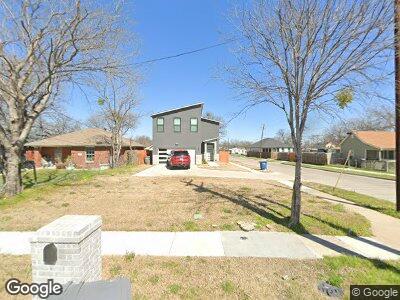
3703 Toronto St Dallas, TX 75212
West Dallas NeighborhoodEstimated Value: $449,000 - $465,000
4
Beds
3
Baths
2,049
Sq Ft
$222/Sq Ft
Est. Value
About This Home
This home is located at 3703 Toronto St, Dallas, TX 75212 and is currently estimated at $454,296, approximately $221 per square foot. 3703 Toronto St is a home located in Dallas County with nearby schools including West Dallas STEM School, Uplift Heights Preparatory Middle, and Uplift Heights Preparatory High School.
Ownership History
Date
Name
Owned For
Owner Type
Purchase Details
Closed on
Nov 1, 2024
Sold by
What It Do Llc
Bought by
What It Do Rentals Llc
Current Estimated Value
Home Financials for this Owner
Home Financials are based on the most recent Mortgage that was taken out on this home.
Original Mortgage
$480,320
Interest Rate
6.85%
Mortgage Type
New Conventional
Purchase Details
Closed on
Sep 26, 2022
Sold by
Marilyn Williams
Bought by
Franklin Tracey
Purchase Details
Closed on
Mar 9, 2019
Sold by
Topletz Investments
Bought by
Williams Marilyn
Home Financials for this Owner
Home Financials are based on the most recent Mortgage that was taken out on this home.
Original Mortgage
$61,557
Interest Rate
4.1%
Mortgage Type
Commercial
Purchase Details
Closed on
Dec 10, 1993
Sold by
City National Bank
Bought by
Carrion Delia F and Cuarenta Francisco
Home Financials for this Owner
Home Financials are based on the most recent Mortgage that was taken out on this home.
Original Mortgage
$27,000
Interest Rate
7.19%
Create a Home Valuation Report for This Property
The Home Valuation Report is an in-depth analysis detailing your home's value as well as a comparison with similar homes in the area
Home Values in the Area
Average Home Value in this Area
Purchase History
| Date | Buyer | Sale Price | Title Company |
|---|---|---|---|
| What It Do Rentals Llc | -- | None Listed On Document | |
| Franklin Tracey | -- | -- | |
| Williams Marilyn | -- | None Available | |
| Carrion Delia F | -- | -- |
Source: Public Records
Mortgage History
| Date | Status | Borrower | Loan Amount |
|---|---|---|---|
| Previous Owner | What It Do Rentals Llc | $480,320 | |
| Previous Owner | Williams Marilyn | $61,557 | |
| Previous Owner | Carrion Delia F | $27,000 |
Source: Public Records
Tax History Compared to Growth
Tax History
| Year | Tax Paid | Tax Assessment Tax Assessment Total Assessment is a certain percentage of the fair market value that is determined by local assessors to be the total taxable value of land and additions on the property. | Land | Improvement |
|---|---|---|---|---|
| 2023 | $10,212 | $110,910 | $90,000 | $20,910 |
| 2022 | $2,773 | $110,910 | $90,000 | $20,910 |
| 2021 | $1,619 | $61,380 | $35,000 | $26,380 |
| 2020 | $1,665 | $61,380 | $0 | $0 |
| 2019 | $1,175 | $41,290 | $20,000 | $21,290 |
| 2018 | $680 | $25,000 | $12,000 | $13,000 |
| 2017 | $680 | $25,000 | $12,000 | $13,000 |
| 2016 | $340 | $12,500 | $12,000 | $500 |
| 2015 | $343 | $12,500 | $12,000 | $500 |
| 2014 | $343 | $12,500 | $12,000 | $500 |
Source: Public Records
Map
Nearby Homes
- 3725 Toronto St
- 3740 Pueblo St
- 3719 Nomas St
- 3710 Morris St
- 3605 Singleton Blvd
- 3638 Bickers St
- 3314 Pueblo St
- 3622 Bickers St
- 3531 Gallagher St
- 3631 Bickers St
- 3627 Bickers St
- 3619 Bickers St
- 3603 Bickers St
- 3539 Furey St
- 1926 Pueblo St
- 3919 Furey St
- 4910 Mcbroom St
- 1962 Morris St
- 3734 Bayside Dr
- 4022 N Westmoreland Rd